5+ The chart below shows the number of households in the US by their annual income in 2007, 2011
The chart below shows the number of households in the US by their annual income in 2007, 2011 and 2015. Summarise the information by selecting and reporting the main features and make comparisons where relevant. Write at least 150 words. hay nhất giúp bạn có thêm tài liệu tham khảo để viết bài luận bằng Tiếng Anh hay hơn.
5+ The chart below shows the number of households in the US by their annual income in 2007, 2011
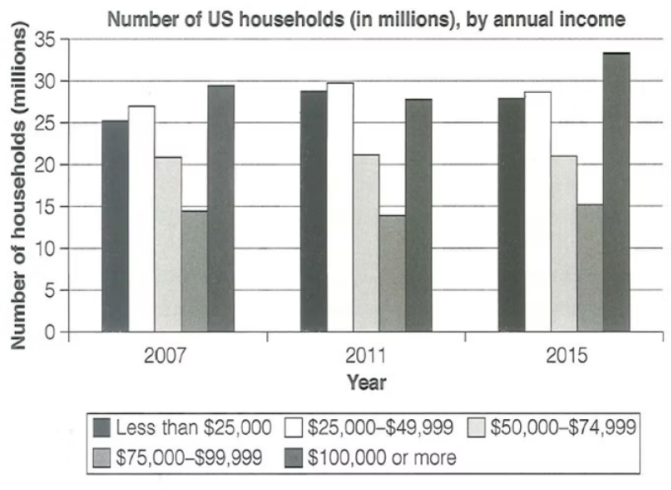
Đề bài: The chart below shows the number of households in the US by their annual income in 2007, 2011 and 2015.
Summarise the information by selecting and reporting the main features and make comparisons where relevant.
Write at least 150 words.
The chart below shows the number of households in the US by their annual income in 2007, 2011 - mẫu 1
The bar chart illustrates the number of households in the United States, measured in millions, according to annual income levels in 2007, 2011, and 2015. Overall, the number of households earning $100,000 or more increased steadily over the period, while other income groups remained relatively stable.
In 2007, households earning between $25,000 and $49,999 and those earning $100,000 or more were the largest groups, each accounting for around 27–28 million households. The lowest income group (less than $25,000) had about 25 million households, while the $50,000–$74,999 and $75,000–$99,999 categories were smaller, at roughly 21 million and 15 million respectively.
By 2011, the number of households earning $100,000 or more rose slightly to around 29 million, overtaking the $25,000–$49,999 group. The other categories showed little change. In 2015, the highest-income group continued to grow, reaching approximately 32 million households, while all other groups remained stable or declined slightly.
In summary, the data shows a clear upward trend in the number of high-income households in the US between 2007 and 2015, suggesting an overall improvement in income distribution at the top end.
Hướng dẫn dịch:
Biểu đồ cột minh họa số lượng hộ gia đình ở Hoa Kỳ (tính bằng triệu) theo mức thu nhập hàng năm vào các năm 2007, 2011 và 2015. Nhìn chung, số hộ có thu nhập từ 100.000 USD trở lên tăng đều trong giai đoạn này, trong khi các nhóm thu nhập khác tương đối ổn định.
Năm 2007, hai nhóm lớn nhất là các hộ có thu nhập từ 25.000–49.999 USD và từ 100.000 USD trở lên, mỗi nhóm khoảng 27–28 triệu hộ. Nhóm thu nhập thấp nhất (dưới 25.000 USD) có khoảng 25 triệu hộ, trong khi các nhóm 50.000–74.999 USD và 75.000–99.999 USD lần lượt khoảng 21 triệu và 15 triệu hộ.
Đến năm 2011, số hộ có thu nhập từ 100.000 USD trở lên tăng nhẹ lên khoảng 29 triệu, vượt qua nhóm 25.000–49.999 USD. Các nhóm khác hầu như không thay đổi. Năm 2015, nhóm thu nhập cao nhất tiếp tục tăng, đạt khoảng 32 triệu hộ, trong khi các nhóm còn lại ổn định hoặc giảm nhẹ.
Tóm lại, dữ liệu cho thấy xu hướng tăng rõ rệt về số lượng hộ có thu nhập cao ở Mỹ từ năm 2007 đến 2015, phản ánh sự cải thiện trong phân bố thu nhập ở nhóm giàu.
The chart below shows the number of households in the US by their annual income in 2007, 2011 - mẫu 2
The chart compares the number of US households by annual income in 2007, 2011, and 2015. It is evident that households earning $100,000 or more increased consistently, while other income groups experienced minimal change.
In 2007, the two largest categories were households earning $25,000–$49,999 and those earning $100,000 or more, both at around 27–28 million. The lowest-income group (under $25,000) followed closely at 25 million, whereas the $50,000–$74,999 and $75,000–$99,999 groups were smaller, at roughly 21 million and 15 million respectively.
By 2011, the number of households in the highest-income group rose slightly to nearly 29 million, becoming the largest category. The figures for other groups remained almost unchanged. In 2015, the upward trend continued, with the $100,000 or more group reaching about 32 million households, while the other categories stayed stable or declined marginally.
Overall, the chart indicates that the proportion of wealthy households in the US grew steadily from 2007 to 2015, while lower and middle-income groups showed little variation.
Hướng dẫn dịch:
Biểu đồ so sánh số lượng hộ gia đình ở Mỹ theo mức thu nhập hàng năm vào các năm 2007, 2011 và 2015. Rõ ràng rằng số hộ có thu nhập từ 100.000 USD trở lên tăng liên tục, trong khi các nhóm thu nhập khác thay đổi không đáng kể.
Năm 2007, hai nhóm lớn nhất là các hộ có thu nhập từ 25.000–49.999 USD và từ 100.000 USD trở lên, đều khoảng 27–28 triệu hộ. Nhóm thu nhập thấp nhất (dưới 25.000 USD) có khoảng 25 triệu hộ, còn các nhóm 50.000–74.999 USD và 75.000–99.999 USD lần lượt khoảng 21 triệu và 15 triệu hộ.
Đến năm 2011, số hộ có thu nhập cao nhất tăng nhẹ lên gần 29 triệu, trở thành nhóm lớn nhất. Các nhóm khác gần như không thay đổi. Năm 2015, xu hướng tăng tiếp tục, với nhóm thu nhập từ 100.000 USD trở lên đạt khoảng 32 triệu hộ, trong khi các nhóm khác ổn định hoặc giảm nhẹ.
Nhìn chung, biểu đồ cho thấy tỷ lệ hộ giàu ở Mỹ tăng đều từ năm 2007 đến 2015, trong khi các nhóm thu nhập thấp và trung bình gần như không biến động.
Xem thêm các bài luận Tiếng Anh hay khác:

TÀI LIỆU CLC DÀNH CHO GIÁO VIÊN VÀ PHỤ HUYNH LỚP 9
Bộ giáo án, bài giảng powerpoint, đề thi file word có đáp án 2026 tại https://tailieugiaovien.com.vn/
Hỗ trợ zalo: VietJack Official
Tổng đài hỗ trợ đăng ký: 084 283 45 85
 Đề thi vào 10 các sở Hà Nội, Tp. Hồ Chí Minh...
41 tài liệu
Đề thi vào 10 các sở Hà Nội, Tp. Hồ Chí Minh...
41 tài liệu
 Giáo án Word 9
95 tài liệu
Giáo án Word 9
95 tài liệu
 Đề thi giữa kì, cuối kì 9
254 tài liệu
Đề thi giữa kì, cuối kì 9
254 tài liệu
 Chuyên đề dạy thêm Toán, Lí, Hóa... 9
71 tài liệu
Chuyên đề dạy thêm Toán, Lí, Hóa... 9
71 tài liệu
 Đề thi HSG 9
8 tài liệu
Đề thi HSG 9
8 tài liệu
 Bài giảng Powerpoint 9
42 tài liệu
Bài giảng Powerpoint 9
42 tài liệu
Công cụ giáo viên (2048.VN)
Tạo- trộn đề thi miễn phí từ file PDF, Word, Giao bài nhanh chóng, Hoàn toàn Free
- Đề thi lớp 1 (các môn học)
- Đề thi lớp 2 (các môn học)
- Đề thi lớp 3 (các môn học)
- Đề thi lớp 4 (các môn học)
- Đề thi lớp 5 (các môn học)
- Đề thi lớp 6 (các môn học)
- Đề thi lớp 7 (các môn học)
- Đề thi lớp 8 (các môn học)
- Đề thi lớp 9 (các môn học)
- Đề thi lớp 10 (các môn học)
- Đề thi lớp 11 (các môn học)
- Đề thi lớp 12 (các môn học)
- Giáo án lớp 1 (các môn học)
- Giáo án lớp 2 (các môn học)
- Giáo án lớp 3 (các môn học)
- Giáo án lớp 4 (các môn học)
- Giáo án lớp 5 (các môn học)
- Giáo án lớp 6 (các môn học)
- Giáo án lớp 7 (các môn học)
- Giáo án lớp 8 (các môn học)
- Giáo án lớp 9 (các môn học)
- Giáo án lớp 10 (các môn học)
- Giáo án lớp 11 (các môn học)
- Giáo án lớp 12 (các môn học)