5+ The graph shows the value in US dollars (in millions of dollars) of investment in funds of
The graph shows the value in US dollars (in millions of dollars) of investment in funds of four categories from 1988 to 2014. Summarise the information by selecting and reporting the main features, and make comparisons where relevant hay nhất giúp bạn có thêm tài liệu tham khảo để viết bài luận bằng Tiếng Anh hay hơn.
5+ The graph shows the value in US dollars (in millions of dollars) of investment in funds of
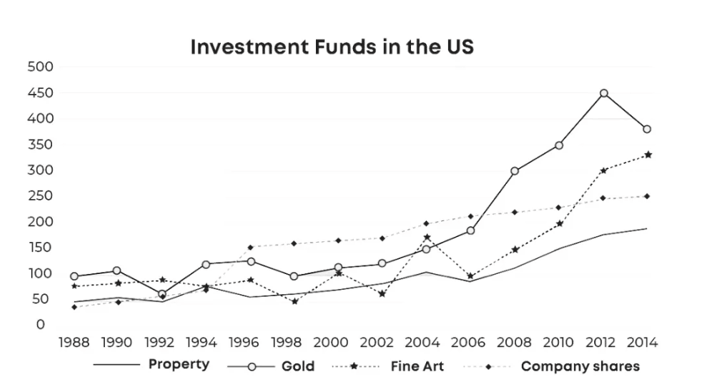
Đề bài: The graph shows the value in US dollars (in millions of dollars) of investment in funds of four categories from 1988 to 2014. Summarise the information by selecting and reporting the main features, and make comparisons where relevant.
The graph shows the value in US dollars (in millions of dollars) of investment in funds of - mẫu 1
The line graph illustrates the value of investment funds in four categories — property, gold, fine art, and company shares — in the US between 1988 and 2014, measured in millions of dollars.
Overall, all four types of investment increased in value over the period, although gold showed the most dramatic growth, while property remained the least valuable investment throughout.
In 1988, gold had the highest value at around $100 million, followed by company shares at approximately $70 million, fine art at $50 million, and property at just under $50 million. Gold fluctuated slightly until 2004, after which it rose sharply, peaking at about $450 million in 2012 before falling to around $380 million in 2014. Company shares also grew steadily, reaching roughly $250 million by 2014. Fine art experienced several ups and downs but ended at around $300 million, while property showed a consistent upward trend, climbing gradually to nearly $200 million by the end of the period.
In summary, gold was the most profitable investment by 2014, while property remained the least lucrative, though all categories showed overall growth.
Hướng dẫn dịch:
Biểu đồ đường thể hiện giá trị của các quỹ đầu tư thuộc bốn loại — bất động sản, vàng, mỹ thuật và cổ phiếu công ty — tại Mỹ từ năm 1988 đến 2014, tính bằng triệu đô la.
Nhìn chung, cả bốn loại hình đầu tư đều tăng giá trị trong suốt giai đoạn, mặc dù vàng có mức tăng mạnh nhất, trong khi bất động sản vẫn là khoản đầu tư có giá trị thấp nhất.
Năm 1988, vàng có giá trị cao nhất khoảng 100 triệu đô la, tiếp theo là cổ phiếu công ty khoảng 70 triệu, mỹ thuật 50 triệu và bất động sản chưa đến 50 triệu. Giá trị vàng dao động nhẹ cho đến năm 2004, sau đó tăng mạnh, đạt đỉnh khoảng 450 triệu vào năm 2012 trước khi giảm xuống khoảng 380 triệu vào năm 2014. Cổ phiếu công ty cũng tăng đều, đạt khoảng 250 triệu vào năm 2014. Mỹ thuật có nhiều biến động nhưng kết thúc ở mức khoảng 300 triệu, trong khi bất động sản tăng ổn định, đạt gần 200 triệu vào cuối giai đoạn.
Tóm lại, vàng là khoản đầu tư sinh lời nhất vào năm 2014, trong khi bất động sản vẫn kém hấp dẫn nhất, dù tất cả các loại hình đều tăng trưởng tổng thể.
The graph shows the value in US dollars (in millions of dollars) of investment in funds of - mẫu 2
The line graph compares the value of investment funds in property, gold, fine art, and company shares in the US from 1988 to 2014.
Overall, the value of all four investment types rose over the period, with gold showing the most significant increase, while property grew more gradually.
At the beginning of the period, gold was the most valuable investment at around $100 million, followed by company shares ($70 million), fine art ($50 million), and property ($40 million). Gold’s value fluctuated until 2004, then surged dramatically to reach a peak of $450 million in 2012 before declining slightly. Fine art and company shares also increased steadily, reaching approximately $300 million and $250 million respectively by 2014. Property showed the slowest growth, rising consistently to about $180 million at the end of the period.
In conclusion, gold experienced the most dramatic growth and remained the most valuable investment, while property was the least profitable but showed steady improvement.
Hướng dẫn dịch:
Biểu đồ đường so sánh giá trị của các quỹ đầu tư vào bất động sản, vàng, mỹ thuật và cổ phiếu công ty tại Mỹ từ năm 1988 đến 2014.
Nhìn chung, giá trị của cả bốn loại hình đầu tư đều tăng trong suốt giai đoạn, trong đó vàng có mức tăng mạnh nhất, còn bất động sản tăng chậm hơn.
Ở đầu giai đoạn, vàng là khoản đầu tư có giá trị cao nhất khoảng 100 triệu đô la, tiếp theo là cổ phiếu công ty (70 triệu), mỹ thuật (50 triệu) và bất động sản (40 triệu). Giá trị vàng dao động cho đến năm 2004, sau đó tăng mạnh, đạt đỉnh 450 triệu vào năm 2012 trước khi giảm nhẹ. Mỹ thuật và cổ phiếu công ty cũng tăng đều, đạt lần lượt khoảng 300 triệu và 250 triệu vào năm 2014. Bất động sản tăng chậm nhất nhưng ổn định, đạt khoảng 180 triệu vào cuối giai đoạn.
Tóm lại, vàng có mức tăng trưởng mạnh nhất và vẫn là khoản đầu tư có giá trị cao nhất, trong khi bất động sản ít sinh lời nhất nhưng tăng đều đặn.
Xem thêm các bài luận Tiếng Anh hay khác:

TÀI LIỆU CLC DÀNH CHO GIÁO VIÊN VÀ PHỤ HUYNH LỚP 9
Bộ giáo án, bài giảng powerpoint, đề thi file word có đáp án 2026 tại https://tailieugiaovien.com.vn/
Hỗ trợ zalo: VietJack Official
Tổng đài hỗ trợ đăng ký: 084 283 45 85
 Đề thi vào 10 các sở Hà Nội, Tp. Hồ Chí Minh...
41 tài liệu
Đề thi vào 10 các sở Hà Nội, Tp. Hồ Chí Minh...
41 tài liệu
 Giáo án Word 9
95 tài liệu
Giáo án Word 9
95 tài liệu
 Đề thi giữa kì, cuối kì 9
254 tài liệu
Đề thi giữa kì, cuối kì 9
254 tài liệu
 Chuyên đề dạy thêm Toán, Lí, Hóa... 9
71 tài liệu
Chuyên đề dạy thêm Toán, Lí, Hóa... 9
71 tài liệu
 Đề thi HSG 9
8 tài liệu
Đề thi HSG 9
8 tài liệu
 Bài giảng Powerpoint 9
42 tài liệu
Bài giảng Powerpoint 9
42 tài liệu
Công cụ giáo viên (2048.VN)
Tạo- trộn đề thi miễn phí từ file PDF, Word, Giao bài nhanh chóng, Hoàn toàn Free
- Đề thi lớp 1 (các môn học)
- Đề thi lớp 2 (các môn học)
- Đề thi lớp 3 (các môn học)
- Đề thi lớp 4 (các môn học)
- Đề thi lớp 5 (các môn học)
- Đề thi lớp 6 (các môn học)
- Đề thi lớp 7 (các môn học)
- Đề thi lớp 8 (các môn học)
- Đề thi lớp 9 (các môn học)
- Đề thi lớp 10 (các môn học)
- Đề thi lớp 11 (các môn học)
- Đề thi lớp 12 (các môn học)
- Giáo án lớp 1 (các môn học)
- Giáo án lớp 2 (các môn học)
- Giáo án lớp 3 (các môn học)
- Giáo án lớp 4 (các môn học)
- Giáo án lớp 5 (các môn học)
- Giáo án lớp 6 (các môn học)
- Giáo án lớp 7 (các môn học)
- Giáo án lớp 8 (các môn học)
- Giáo án lớp 9 (các môn học)
- Giáo án lớp 10 (các môn học)
- Giáo án lớp 11 (các môn học)
- Giáo án lớp 12 (các môn học)