5+ The pie charts show the size of classes in primary schools in four states in australia in 2010
The pie charts show the size of classes in primary schools in four states in australia in 2010 hay nhất giúp bạn có thêm tài liệu tham khảo để viết bài luận bằng Tiếng Anh hay hơn.
5+ The pie charts show the size of classes in primary schools in four states in australia in 2010
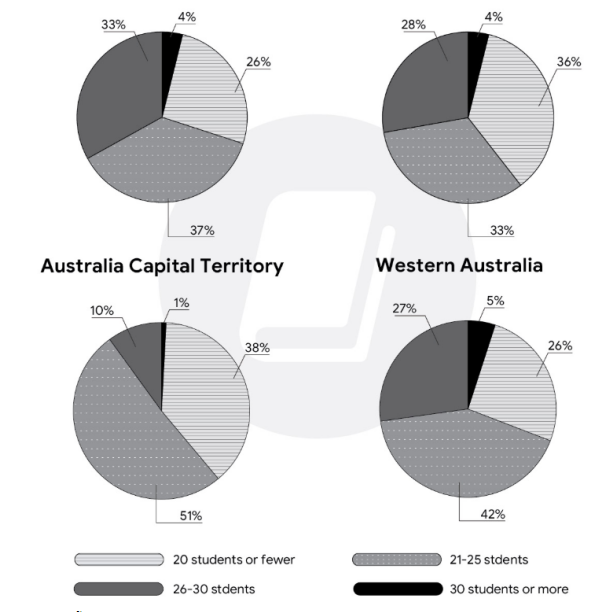
Đề bài: The pie charts show the size of classes in primary schools in four states in australia in 2010
The pie charts show the size of classes in primary schools in four states in australia in 2010 - mẫu 1
The pie charts compare the proportions of different class sizes in primary schools in the Australian Capital Territory and Western Australia in 2010. Overall, smaller classes were more common in the Australian Capital Territory, while Western Australia had a higher proportion of larger classes.
In the Australian Capital Territory, the majority of classes contained 20 students or fewer, accounting for 51% in one chart and 33% in the other. Classes with 21–25 students were also significant, making up 38% and 37% respectively. By contrast, only a small proportion of classes had 26–30 students (10% and 26%) or 30 students or more (1% and 4%).
In Western Australia, the distribution was more balanced, but larger classes were more frequent. Classes with 21–25 students represented 42% and 33%, while those with 20 students or fewer accounted for 27% and 28%. Notably, classes with 26–30 students were relatively common, at 26% and 36%, and the proportion of classes with 30 students or more was slightly higher than in the Australian Capital Territory, at 5% and 4%.
In summary, the Australian Capital Territory tended to have smaller class sizes, whereas Western Australia had a greater share of medium and large classes.
Hướng dẫn dịch:
Các biểu đồ tròn so sánh tỷ lệ các quy mô lớp học khác nhau trong các trường tiểu học ở Lãnh thổ Thủ đô Úc và Tây Úc năm 2010. Nhìn chung, lớp học nhỏ phổ biến hơn ở Lãnh thổ Thủ đô Úc, trong khi Tây Úc có tỷ lệ lớp học lớn cao hơn.
Tại Lãnh thổ Thủ đô Úc, phần lớn các lớp có 20 học sinh trở xuống, chiếm 51% ở một biểu đồ và 33% ở biểu đồ còn lại. Các lớp có 21–25 học sinh cũng chiếm tỷ lệ đáng kể, lần lượt là 38% và 37%. Ngược lại, chỉ một phần nhỏ các lớp có 26–30 học sinh (10% và 26%) hoặc 30 học sinh trở lên (1% và 4%).
Ở Tây Úc, phân bố lớp học cân bằng hơn nhưng lớp lớn phổ biến hơn. Các lớp có 21–25 học sinh chiếm 42% và 33%, trong khi lớp có 20 học sinh trở xuống chiếm 27% và 28%. Đáng chú ý, lớp có 26–30 học sinh khá phổ biến (26% và 36%), và tỷ lệ lớp có 30 học sinh trở lên cao hơn một chút so với Lãnh thổ Thủ đô Úc (5% và 4%).
Tóm lại, Lãnh thổ Thủ đô Úc có xu hướng có lớp học nhỏ hơn, trong khi Tây Úc có nhiều lớp trung bình và lớn hơn.
The pie charts show the size of classes in primary schools in four states in australia in 2010 - mẫu 2
The four pie charts illustrate the distribution of class sizes in primary schools in two Australian states—the Australian Capital Territory and Western Australia—in 2010. It is clear that the Australian Capital Territory had more small classes, while Western Australia had more medium and large ones.
In the Australian Capital Territory, classes with 20 students or fewer were the most common, accounting for just over half (51%) in one chart and one-third (33%) in the other. Classes with 21–25 students were also prevalent, at 38% and 37%. Larger classes were relatively rare, with only 10% and 26% having 26–30 students, and just 1% and 4% containing 30 or more.
In contrast, Western Australia showed a higher proportion of larger classes. The share of classes with 21–25 students was 42% and 33%, while those with 20 or fewer students made up 27% and 28%. Classes with 26–30 students were more frequent, at 26% and 36%, and those with 30 or more students accounted for 5% and 4%.
Overall, the data suggests that primary schools in the Australian Capital Territory generally had smaller class sizes, whereas Western Australia had more medium and large classes.
Hướng dẫn dịch:
Bốn biểu đồ tròn minh họa sự phân bố quy mô lớp học trong các trường tiểu học ở hai bang của Úc — Lãnh thổ Thủ đô Úc và Tây Úc — vào năm 2010. Rõ ràng rằng Lãnh thổ Thủ đô Úc có nhiều lớp nhỏ hơn, trong khi Tây Úc có nhiều lớp trung bình và lớn hơn.
Ở Lãnh thổ Thủ đô Úc, lớp có 20 học sinh trở xuống phổ biến nhất, chiếm hơn một nửa (51%) ở một biểu đồ và một phần ba (33%) ở biểu đồ còn lại. Các lớp có 21–25 học sinh cũng chiếm tỷ lệ cao, lần lượt là 38% và 37%. Lớp lớn tương đối hiếm, chỉ có 10% và 26% có 26–30 học sinh, và 1% và 4% có từ 30 học sinh trở lên.
Ngược lại, Tây Úc có tỷ lệ lớp lớn cao hơn. Các lớp có 21–25 học sinh chiếm 42% và 33%, trong khi lớp có 20 học sinh trở xuống chiếm 27% và 28%. Lớp có 26–30 học sinh phổ biến hơn (26% và 36%), và lớp có 30 học sinh trở lên chiếm 5% và 4%.
Nhìn chung, dữ liệu cho thấy các trường tiểu học ở Lãnh thổ Thủ đô Úc thường có lớp học nhỏ hơn, trong khi Tây Úc có nhiều lớp trung bình và lớn hơn.
Xem thêm các bài luận Tiếng Anh hay khác:

TÀI LIỆU CLC DÀNH CHO GIÁO VIÊN VÀ PHỤ HUYNH LỚP 9
Bộ giáo án, bài giảng powerpoint, đề thi file word có đáp án 2026 tại https://tailieugiaovien.com.vn/
Hỗ trợ zalo: VietJack Official
Tổng đài hỗ trợ đăng ký: 084 283 45 85
 Đề thi vào 10 các sở Hà Nội, Tp. Hồ Chí Minh...
41 tài liệu
Đề thi vào 10 các sở Hà Nội, Tp. Hồ Chí Minh...
41 tài liệu
 Giáo án Word 9
95 tài liệu
Giáo án Word 9
95 tài liệu
 Đề thi giữa kì, cuối kì 9
254 tài liệu
Đề thi giữa kì, cuối kì 9
254 tài liệu
 Chuyên đề dạy thêm Toán, Lí, Hóa... 9
71 tài liệu
Chuyên đề dạy thêm Toán, Lí, Hóa... 9
71 tài liệu
 Đề thi HSG 9
8 tài liệu
Đề thi HSG 9
8 tài liệu
 Bài giảng Powerpoint 9
42 tài liệu
Bài giảng Powerpoint 9
42 tài liệu
Công cụ giáo viên (2048.VN)
Tạo- trộn đề thi miễn phí từ file PDF, Word, Giao bài nhanh chóng, Hoàn toàn Free
- Đề thi lớp 1 (các môn học)
- Đề thi lớp 2 (các môn học)
- Đề thi lớp 3 (các môn học)
- Đề thi lớp 4 (các môn học)
- Đề thi lớp 5 (các môn học)
- Đề thi lớp 6 (các môn học)
- Đề thi lớp 7 (các môn học)
- Đề thi lớp 8 (các môn học)
- Đề thi lớp 9 (các môn học)
- Đề thi lớp 10 (các môn học)
- Đề thi lớp 11 (các môn học)
- Đề thi lớp 12 (các môn học)
- Giáo án lớp 1 (các môn học)
- Giáo án lớp 2 (các môn học)
- Giáo án lớp 3 (các môn học)
- Giáo án lớp 4 (các môn học)
- Giáo án lớp 5 (các môn học)
- Giáo án lớp 6 (các môn học)
- Giáo án lớp 7 (các môn học)
- Giáo án lớp 8 (các môn học)
- Giáo án lớp 9 (các môn học)
- Giáo án lớp 10 (các môn học)
- Giáo án lớp 11 (các môn học)
- Giáo án lớp 12 (các môn học)