5+ The charts below give information about the world’s top three producers of four different dairy products in 2012
The charts below give information about the world’s top three producers of four different dairy products in 2012. Summarise the information by selecting and reporting the main features, and make comparisons where relevant hay nhất giúp bạn có thêm tài liệu tham khảo để viết bài luận bằng Tiếng Anh hay hơn.
5+ The charts below give information about the world’s top three producers of four different dairy products in 2012
Đề bài: The charts below give information about the world’s top three producers of four different dairy products in 2012. Summarise the information by selecting and reporting the main features, and make comparisons where relevant.
The charts below give information about the world’s top three producers of four different dairy products in 2012 - mẫu 1
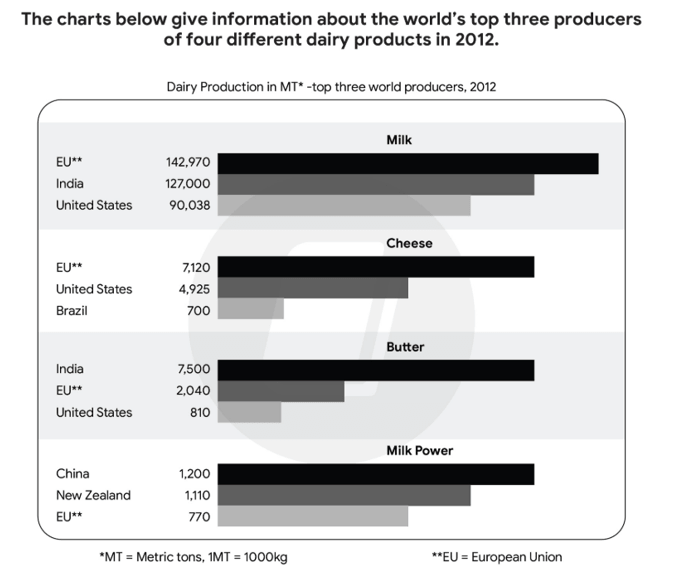
The charts illustrate the world’s top three producers of four different dairy products — milk, cheese, butter, and milk powder — in 2012, measured in metric tons.
Overall, the European Union (EU) was the leading producer of most dairy products, except for butter, which was dominated by India. Meanwhile, China and New Zealand were the main producers of milk powder.
In terms of milk production, the EU ranked first with 142,970 metric tons, followed by India (127,000) and the United States (90,038). The EU also led cheese production at 7,120 metric tons, nearly 2,000 more than the United States, while Brazil produced only 700 metric tons.
For butter, India was the largest producer, with 7,500 metric tons — more than three times the EU’s output (2,040) and nearly ten times that of the United States (810). In contrast, milk powder production was highest in China (1,200 metric tons), slightly ahead of New Zealand (1,110), while the EU produced the least (770).
In summary, the EU dominated global dairy production in 2012, particularly in milk and cheese, whereas India led in butter and China in milk powder.
Hướng dẫn dịch:
Các biểu đồ thể hiện ba quốc gia hoặc khu vực sản xuất hàng đầu thế giới về bốn loại sản phẩm từ sữa — sữa, phô mai, bơ và sữa bột — vào năm 2012, tính bằng tấn mét.
Nhìn chung, Liên minh châu Âu (EU) là nhà sản xuất hàng đầu của hầu hết các sản phẩm từ sữa, ngoại trừ bơ, vốn do Ấn Độ dẫn đầu. Trong khi đó, Trung Quốc và New Zealand là những nhà sản xuất chính của sữa bột.
Về sản xuất sữa, EU đứng đầu với 142.970 tấn, tiếp theo là Ấn Độ (127.000) và Hoa Kỳ (90.038). EU cũng dẫn đầu về sản xuất phô mai với 7.120 tấn, cao hơn gần 2.000 tấn so với Hoa Kỳ, trong khi Brazil chỉ sản xuất 700 tấn.
Đối với bơ, Ấn Độ là nhà sản xuất lớn nhất với 7.500 tấn — gấp hơn ba lần sản lượng của EU (2.040) và gần gấp mười lần của Hoa Kỳ (810). Ngược lại, sản xuất sữa bột cao nhất ở Trung Quốc (1.200 tấn), nhỉnh hơn New Zealand (1.110), trong khi EU sản xuất ít nhất (770).
Tóm lại, EU thống trị ngành sản xuất sữa toàn cầu năm 2012, đặc biệt trong lĩnh vực sữa và phô mai, trong khi Ấn Độ dẫn đầu về bơ và Trung Quốc về sữa bột.
The charts below give information about the world’s top three producers of four different dairy products in 2012 - mẫu 2
The charts compare the top three producers of milk, cheese, butter, and milk powder worldwide in 2012, measured in metric tons.
Overall, the European Union was the largest producer of milk and cheese, India led butter production, and China produced the most milk powder.
The EU produced the highest amount of milk at 142,970 metric tons, followed by India (127,000) and the United States (90,038). Similarly, the EU dominated cheese production with 7,120 metric tons, while the United States produced 4,925 and Brazil only 700.
In contrast, India was the leading butter producer, with 7,500 metric tons, far exceeding the EU (2,040) and the United States (810). For milk powder, China ranked first with 1,200 metric tons, slightly ahead of New Zealand (1,110), whereas the EU produced the least at 770.
In conclusion, the EU was the top producer of most dairy products, but India and China led in butter and milk powder respectively, showing regional specialization in dairy production.
Hướng dẫn dịch:
Các biểu đồ so sánh ba nhà sản xuất hàng đầu thế giới về sữa, phô mai, bơ và sữa bột vào năm 2012, tính bằng tấn mét.
Nhìn chung, Liên minh châu Âu là nhà sản xuất lớn nhất về sữa và phô mai, Ấn Độ dẫn đầu về sản xuất bơ, và Trung Quốc sản xuất nhiều sữa bột nhất.
EU sản xuất lượng sữa cao nhất với 142.970 tấn, tiếp theo là Ấn Độ (127.000) và Hoa Kỳ (90.038). Tương tự, EU thống trị sản xuất phô mai với 7.120 tấn, trong khi Hoa Kỳ sản xuất 4.925 và Brazil chỉ 700.
Ngược lại, Ấn Độ là nhà sản xuất bơ hàng đầu với 7.500 tấn, vượt xa EU (2.040) và Hoa Kỳ (810). Đối với sữa bột, Trung Quốc đứng đầu với 1.200 tấn, nhỉnh hơn New Zealand (1.110), trong khi EU sản xuất ít nhất với 770.
Tóm lại, EU là nhà sản xuất hàng đầu của hầu hết các sản phẩm từ sữa, nhưng Ấn Độ và Trung Quốc lần lượt dẫn đầu về bơ và sữa bột, cho thấy sự chuyên môn hóa theo khu vực trong ngành sữa toàn cầu.
Xem thêm các bài luận Tiếng Anh hay khác:

TÀI LIỆU CLC DÀNH CHO GIÁO VIÊN VÀ PHỤ HUYNH LỚP 9
Bộ giáo án, bài giảng powerpoint, đề thi file word có đáp án 2026 tại https://tailieugiaovien.com.vn/
Hỗ trợ zalo: VietJack Official
Tổng đài hỗ trợ đăng ký: 084 283 45 85
 Đề thi vào 10 các sở Hà Nội, Tp. Hồ Chí Minh...
41 tài liệu
Đề thi vào 10 các sở Hà Nội, Tp. Hồ Chí Minh...
41 tài liệu
 Giáo án Word 9
95 tài liệu
Giáo án Word 9
95 tài liệu
 Đề thi giữa kì, cuối kì 9
254 tài liệu
Đề thi giữa kì, cuối kì 9
254 tài liệu
 Chuyên đề dạy thêm Toán, Lí, Hóa... 9
71 tài liệu
Chuyên đề dạy thêm Toán, Lí, Hóa... 9
71 tài liệu
 Đề thi HSG 9
8 tài liệu
Đề thi HSG 9
8 tài liệu
 Bài giảng Powerpoint 9
42 tài liệu
Bài giảng Powerpoint 9
42 tài liệu
Công cụ giáo viên (2048.VN)
Tạo- trộn đề thi miễn phí từ file PDF, Word, Giao bài nhanh chóng, Hoàn toàn Free
- Đề thi lớp 1 (các môn học)
- Đề thi lớp 2 (các môn học)
- Đề thi lớp 3 (các môn học)
- Đề thi lớp 4 (các môn học)
- Đề thi lớp 5 (các môn học)
- Đề thi lớp 6 (các môn học)
- Đề thi lớp 7 (các môn học)
- Đề thi lớp 8 (các môn học)
- Đề thi lớp 9 (các môn học)
- Đề thi lớp 10 (các môn học)
- Đề thi lớp 11 (các môn học)
- Đề thi lớp 12 (các môn học)
- Giáo án lớp 1 (các môn học)
- Giáo án lớp 2 (các môn học)
- Giáo án lớp 3 (các môn học)
- Giáo án lớp 4 (các môn học)
- Giáo án lớp 5 (các môn học)
- Giáo án lớp 6 (các môn học)
- Giáo án lớp 7 (các môn học)
- Giáo án lớp 8 (các môn học)
- Giáo án lớp 9 (các môn học)
- Giáo án lớp 10 (các môn học)
- Giáo án lớp 11 (các môn học)
- Giáo án lớp 12 (các môn học)