5+ The graph below shows the number of overseas visitors to three different areas in a European country
The graph below shows the number of overseas visitors to three different areas in a European country between 1987 and 2007. Summarise the information by selecting and reporting the main features and make comparisons where relevant hay nhất giúp bạn có thêm tài liệu tham khảo để viết bài luận bằng Tiếng Anh hay hơn.
5+ The graph below shows the number of overseas visitors to three different areas in a European country
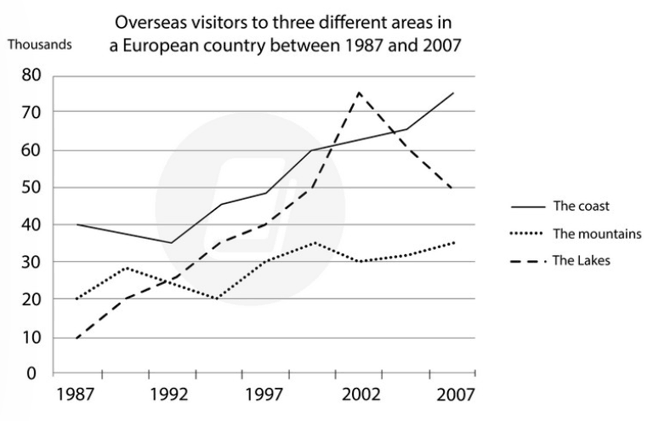
Đề bài: The graph below shows the number of overseas visitors to three different areas in a European country between 1987 and 2007. Summarise the information by selecting and reporting the main features and make comparisons where relevant.
The graph below shows the number of overseas visitors to three different areas in a European country - mẫu 1
The line graph illustrates the number of overseas visitors to three different areas — the coast, the mountains, and the lakes — in a European country between 1987 and 2007.
Overall, the number of visitors to all three areas increased over the period, although the lakes experienced a sharp rise followed by a decline, while the coast showed steady growth and the mountains remained relatively stable.
In 1987, the coast attracted the highest number of visitors at around 40,000, followed by the mountains with about 20,000 and the lakes with only 10,000. Over the next decade, the number of visitors to the lakes rose dramatically, surpassing the other two areas by 2002, when it peaked at approximately 75,000. However, this figure fell sharply to around 50,000 by 2007.
Meanwhile, the number of visitors to the coast declined slightly until 1992 but then increased steadily, reaching about 70,000 by the end of the period. In contrast, the mountains saw only modest growth, rising from 20,000 in 1987 to roughly 30,000 in 2007.
In summary, although all three areas became more popular among overseas tourists, the coast showed the most consistent upward trend, while the lakes experienced the most dramatic fluctuations.
Hướng dẫn dịch:
Biểu đồ đường thể hiện số lượng du khách nước ngoài đến ba khu vực khác nhau — vùng ven biển, vùng núi và vùng hồ — ở một quốc gia châu Âu trong giai đoạn từ năm 1987 đến 2007.
Nhìn chung, số lượng du khách đến cả ba khu vực đều tăng trong suốt giai đoạn, mặc dù vùng hồ có sự tăng mạnh rồi giảm, trong khi vùng ven biển tăng đều và vùng núi tương đối ổn định.
Năm 1987, vùng ven biển thu hút số lượng du khách cao nhất, khoảng 40.000 người, tiếp theo là vùng núi với khoảng 20.000 và vùng hồ chỉ có 10.000. Trong thập kỷ tiếp theo, số du khách đến vùng hồ tăng mạnh, vượt qua hai khu vực còn lại vào năm 2002 khi đạt đỉnh khoảng 75.000 người. Tuy nhiên, con số này giảm nhanh xuống khoảng 50.000 vào năm 2007.
Trong khi đó, số du khách đến vùng ven biển giảm nhẹ đến năm 1992 nhưng sau đó tăng đều, đạt khoảng 70.000 vào cuối giai đoạn. Ngược lại, vùng núi chỉ tăng nhẹ, từ 20.000 năm 1987 lên khoảng 30.000 năm 2007.
Tóm lại, mặc dù cả ba khu vực đều trở nên phổ biến hơn với du khách nước ngoài, vùng ven biển có xu hướng tăng ổn định nhất, còn vùng hồ biến động mạnh nhất.
The graph below shows the number of overseas visitors to three different areas in a European country - mẫu 2
The line graph compares the number of overseas visitors to three areas — the coast, the mountains, and the lakes — in a European country between 1987 and 2007.
Overall, the number of visitors to all areas rose, but the lakes experienced the most dramatic changes, while the coast showed continuous growth and the mountains remained comparatively low.
In 1987, the coast was the most visited area with around 40,000 tourists, followed by the mountains at 20,000 and the lakes at 10,000. Visitor numbers to the coast fell slightly by 1992 but then increased steadily, reaching about 70,000 by 2007. The mountains saw a gradual rise to roughly 30,000 visitors by the end of the period.
By contrast, the lakes showed a striking upward trend until 2002, when the number of visitors peaked at approximately 75,000. After that, it declined sharply to around 50,000 in 2007, though still higher than its initial figure.
In conclusion, while all three areas attracted more overseas visitors over the 20-year period, the coast maintained steady growth, the lakes fluctuated sharply, and the mountains remained the least popular destination.
Hướng dẫn dịch:
Biểu đồ đường so sánh số lượng du khách nước ngoài đến ba khu vực — vùng ven biển, vùng núi và vùng hồ — ở một quốc gia châu Âu trong giai đoạn từ năm 1987 đến 2007.
Nhìn chung, số lượng du khách đến tất cả các khu vực đều tăng, nhưng vùng hồ có sự thay đổi mạnh nhất, trong khi vùng ven biển tăng liên tục và vùng núi vẫn ở mức thấp hơn.
Năm 1987, vùng ven biển là nơi được ghé thăm nhiều nhất với khoảng 40.000 du khách, tiếp theo là vùng núi 20.000 và vùng hồ 10.000. Số du khách đến vùng ven biển giảm nhẹ đến năm 1992 nhưng sau đó tăng đều, đạt khoảng 70.000 vào năm 2007. Vùng núi tăng dần lên khoảng 30.000 du khách vào cuối giai đoạn.
Ngược lại, vùng hồ có xu hướng tăng mạnh đến năm 2002, khi số du khách đạt đỉnh khoảng 75.000. Sau đó, con số này giảm nhanh xuống khoảng 50.000 vào năm 2007, dù vẫn cao hơn mức ban đầu.
Tóm lại, trong suốt 20 năm, cả ba khu vực đều thu hút nhiều du khách nước ngoài hơn, vùng ven biển tăng ổn định, vùng hồ biến động mạnh, còn vùng núi vẫn là điểm đến ít phổ biến nhất.
Xem thêm các bài luận Tiếng Anh hay khác:

TÀI LIỆU CLC DÀNH CHO GIÁO VIÊN VÀ PHỤ HUYNH LỚP 9
Bộ giáo án, bài giảng powerpoint, đề thi file word có đáp án 2026 tại https://tailieugiaovien.com.vn/
Hỗ trợ zalo: VietJack Official
Tổng đài hỗ trợ đăng ký: 084 283 45 85
 Đề thi vào 10 các sở Hà Nội, Tp. Hồ Chí Minh...
41 tài liệu
Đề thi vào 10 các sở Hà Nội, Tp. Hồ Chí Minh...
41 tài liệu
 Giáo án Word 9
95 tài liệu
Giáo án Word 9
95 tài liệu
 Đề thi giữa kì, cuối kì 9
254 tài liệu
Đề thi giữa kì, cuối kì 9
254 tài liệu
 Chuyên đề dạy thêm Toán, Lí, Hóa... 9
71 tài liệu
Chuyên đề dạy thêm Toán, Lí, Hóa... 9
71 tài liệu
 Đề thi HSG 9
8 tài liệu
Đề thi HSG 9
8 tài liệu
 Bài giảng Powerpoint 9
42 tài liệu
Bài giảng Powerpoint 9
42 tài liệu
Công cụ giáo viên (2048.VN)
Tạo- trộn đề thi miễn phí từ file PDF, Word, Giao bài nhanh chóng, Hoàn toàn Free
- Đề thi lớp 1 (các môn học)
- Đề thi lớp 2 (các môn học)
- Đề thi lớp 3 (các môn học)
- Đề thi lớp 4 (các môn học)
- Đề thi lớp 5 (các môn học)
- Đề thi lớp 6 (các môn học)
- Đề thi lớp 7 (các môn học)
- Đề thi lớp 8 (các môn học)
- Đề thi lớp 9 (các môn học)
- Đề thi lớp 10 (các môn học)
- Đề thi lớp 11 (các môn học)
- Đề thi lớp 12 (các môn học)
- Giáo án lớp 1 (các môn học)
- Giáo án lớp 2 (các môn học)
- Giáo án lớp 3 (các môn học)
- Giáo án lớp 4 (các môn học)
- Giáo án lớp 5 (các môn học)
- Giáo án lớp 6 (các môn học)
- Giáo án lớp 7 (các môn học)
- Giáo án lớp 8 (các môn học)
- Giáo án lớp 9 (các môn học)
- Giáo án lớp 10 (các môn học)
- Giáo án lớp 11 (các môn học)
- Giáo án lớp 12 (các môn học)