
5+ The chart and graph below give the information about three categories of workers
The chart and graph below give the information about three categories of workers in Australia and unemployment levels within those categories. Summarise the information by selecting and reporting the main features, and make comparisons where relevant. Write at least 150 words hay nhất giúp bạn có thêm tài liệu tham khảo để viết bài luận bằng Tiếng Anh hay hơn.
- The chart and graph below give the information about three categories of workers (mẫu 1)
- The chart and graph below give the information about three categories of workers (mẫu 2)
- The chart and graph below give the information about three categories of workers (mẫu 3)
- The chart and graph below give the information about three categories of workers (mẫu 4)
- The chart and graph below give the information about three categories of workers (mẫu 5)
5+ The chart and graph below give the information about three categories of workers
Đề bài: The chart and graph below give the information about three categories of workers in Australia and unemployment levels within those categories. Summarise the information by selecting and reporting the main features, and make comparisons where relevant. Write at least 150 words
The chart and graph below give the information about three categories of workers - mẫu 1
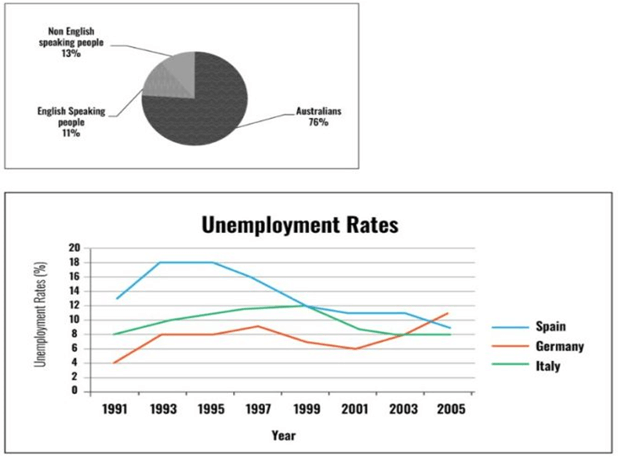
The pie chart illustrates the proportion of three different groups of workers in Australia in the year of 1991 while the line chart shows the changes in the unemployment rates of 3 countries, namely Spain, Germany and Italy, from 1991 to 2005.
Overall, Australia-born workers represented the largest proportion in the total workforce of Australia. In addition, while Spain and Italy witnessed a downward trend in unemployment level, that of Germany grew and remained the highest at the end of the period.
Regarding workforce composition, in 1991, the vast majority were people who were born in Australia, accounting for 76%. Far fewer were those originating from countries that do not speak English, at 13%, which was slightly higher than the figure for workers from English-speaking nations, at 11%.
Concerning the patterns of unemployment, that of Spain fluctuated with a downward trend, dropping from around 13% in 1991 to 9% in 2005 after reaching a peak of 18% in the years between 1993 and 1995. Meanwhile, the unemployment level of Italy grew steadily from 8% in 1991 to hit the highest point of 12% in 1999 before declining back to 8% in 2003 and ending at this figure in 2005. The unemployment rate in Germany, on the other hand, doubled from 4% in 1991 to 9% in 1997. This number, despite a noticeable decrease to 6% in 2001, saw a steep climb from 6% to 11% in 2005, ending the period as the highest among the other countries.
The chart and graph below give the information about three categories of workers - mẫu 2
The given charts illustrate the distribution of the Australian workforce as well as unemployment rates of various worker types in three countries from 1991 to 2005. Overall, the vast majority of the workforce in Australia was Australian, followed distantly by non-English speaking and English-speaking people. Additionally, the unemployment figure for Spain declined, while the statistics of Germany increased and those of Italy fluctuated despite an increase in the middle of the period.
Concerning the worker categories, Australians made up the by far greatest percentage of workers, at 76%. The figures for non-English speaking and English-speaking workers were mostly comparable, standing at 13% and 11% respectively.
Regarding unemployment, the rate of Spanish people started highest at about 13%, then grew rapidly to 18% in 1993. It stayed constant in the next two years before plummeting to a low of approximately 9% in 2005. By contrast, the unemployment level in Germany increased significantly by almost threefolds from 4% in 1991 to rank first at slightly under 12% at the end of the period. Finally, the proportion for Italy underwent a constant growth of about 4% to 12% in the first 8 years prior to a noticeable dive back to 8% in the final year, moving from second to third position.
The chart and graph below give the information about three categories of workers - mẫu 3
The pie chart and line graph provided illustrate the composition of Australia’s workforce and the unemployment rates in Spain, Germany, and Italy over a 14-year period from 1991 to 2005.
Overall, the majority of the Australian workforce is comprised of English speakers, and over the years, Spain saw a dramatic decline in unemployment, while Italy witnessed a fall followed by a slight increase.
The pie chart demonstrates a workforce predominantly composed of Australians, who constitute 76% of the total. Non-English-speaking people account for 13%, while the remaining 11% of the workforce are English speaking people, presumably representing those who do not fall into the former two categories.
Examining the unemployment trends, Spain had a significant reduction in its unemployment rate, from the highest point of approximately 18% in 1993 to just under 8% in 2005. In contrast, Italy’s unemployment rate remained relatively stable with minor fluctuations around 10%, while Germany experienced an increase from the lowest rate of about 4% in 1991 to peak at around 11% in 1999.
The chart and graph below give the information about three categories of workers - mẫu 4
The pie chart depicts three distinct categories of workers residing in Australia. The line graph, on the other hand, illustrates unemployment trends in three different countries throughout the period from 1991 to 2005.
It is clear that Australian workers accounted for a vast majority of the graph given. Regarding the second graph, the interesting point is that there were 3 distinctive trends in accordance with 3 countries.
As the first chart shows, Australians made up the largest portion of the workforce, occupying a substantial 76% share. Conversely, non-English and English-speaking individuals only constituted 13% and 11%, respectively.
The line graph reveals three unique trends for each country’s unemployment rate. Germany’s rate experienced significant fluctuations, starting at 4% in 1991 before reaching 10% by 2005. In contrast, Spain’s rate went up to its peak of 18% in 1995, but then gradually decreased, eventually stabilizing at around 8%. Finally, Italy’s rate saw a rise to 12% in 1999 but then steadily declined to its starting point.
The chart and graph below give the information about three categories of workers - mẫu 5
The pie chart depicts the composition of the Australian workforce, while the line graph illustrates changes in unemployment across three European nations from 1991 to 2005. It is evident that Australians constitute the majority of the workforce in their own country, whereas unemployment trends vary among the countries featured in the line graph.
In Australia, the overwhelming majority of employees are native Australians, comprising 76%. The remaining quarter of the workforce consists of English-speaking and non-English-speaking individuals. Specifically, those who do not speak English constitute 13% of Australia’s workforce, while 11% are foreign English speakers, representing the smallest group.
Regarding the line graph, Spain had the highest unemployment rate among the three countries, at 13%, followed by Italy and Germany, with rates of 8% and 4%, respectively. Spain's unemployment rate peaked between 1993 and 1995 at 18%, before declining for most of the remaining years, reaching 9% in 2005. Italy's data, on the other hand, initially increased steadily to a peak of 12% in 1999, before decreasing until 2005, when the unemployment rate reverted to its 1991 level. Germany was the only country to experience a rise in unemployment; following a period of uncertainty until 2001, its rate surpassed those of Spain and Italy, reaching a record high of 11% in 2005.
Xem thêm các bài luận Tiếng Anh hay khác:

TÀI LIỆU CLC DÀNH CHO GIÁO VIÊN VÀ PHỤ HUYNH LỚP 9
+ Bộ giáo án, bài giảng powerpoint, đề thi file word có đáp án 2025 tại https://tailieugiaovien.com.vn/
+ Hỗ trợ zalo: VietJack Official
+ Tổng đài hỗ trợ đăng ký : 084 283 45 85
Đã có app VietJack trên điện thoại, giải bài tập SGK, SBT Soạn văn, Văn mẫu, Thi online, Bài giảng....miễn phí. Tải ngay ứng dụng trên Android và iOS.


Nếu thấy hay, hãy động viên và chia sẻ nhé! Các bình luận không phù hợp với nội quy bình luận trang web sẽ bị cấm bình luận vĩnh viễn.
- Đề thi lớp 1 (các môn học)
- Đề thi lớp 2 (các môn học)
- Đề thi lớp 3 (các môn học)
- Đề thi lớp 4 (các môn học)
- Đề thi lớp 5 (các môn học)
- Đề thi lớp 6 (các môn học)
- Đề thi lớp 7 (các môn học)
- Đề thi lớp 8 (các môn học)
- Đề thi lớp 9 (các môn học)
- Đề thi lớp 10 (các môn học)
- Đề thi lớp 11 (các môn học)
- Đề thi lớp 12 (các môn học)
- Giáo án lớp 1 (các môn học)
- Giáo án lớp 2 (các môn học)
- Giáo án lớp 3 (các môn học)
- Giáo án lớp 4 (các môn học)
- Giáo án lớp 5 (các môn học)
- Giáo án lớp 6 (các môn học)
- Giáo án lớp 7 (các môn học)
- Giáo án lớp 8 (các môn học)
- Giáo án lớp 9 (các môn học)
- Giáo án lớp 10 (các môn học)
- Giáo án lớp 11 (các môn học)
- Giáo án lớp 12 (các môn học)


 Giải bài tập SGK & SBT
 Tài liệu giáo viên
 Sách
Sách
 Khóa học
 Thi online
 Hỏi đáp