
5+ The chart below compares the number of people per household by percentage in the UK
The chart below compares the number of people per household* by percentage in the UK in 1981 and 2001. Summarise the information by selecting and reporting the main features, and make comparisons where relevant. Write at least 150 words hay nhất giúp bạn có thêm tài liệu tham khảo để viết bài luận bằng Tiếng Anh hay hơn.
- The chart below compares the number of people per household by percentage in the UK (mẫu 1)
- The chart below compares the number of people per household by percentage in the UK (mẫu 2)
- The chart below compares the number of people per household by percentage in the UK (mẫu 3)
- The chart below compares the number of people per household by percentage in the UK (mẫu 4)
- The chart below compares the number of people per household by percentage in the UK (mẫu 5)
- The chart below compares the number of people per household by percentage in the UK (mẫu 6)
- The chart below compares the number of people per household by percentage in the UK (mẫu 7)
- The chart below compares the number of people per household by percentage in the UK (mẫu 8)
- The chart below compares the number of people per household by percentage in the UK (mẫu 9)
- The chart below compares the number of people per household by percentage in the UK (mẫu 10)
5+ The chart below compares the number of people per household by percentage in the UK
Đề bài: The chart below compares the number of people per household* by percentage in the UK in 1981 and 2001. Summarise the information by selecting and reporting the main features, and make comparisons where relevant. Write at least 150 words
The chart below compares the number of people per household by percentage in the UK - mẫu 1
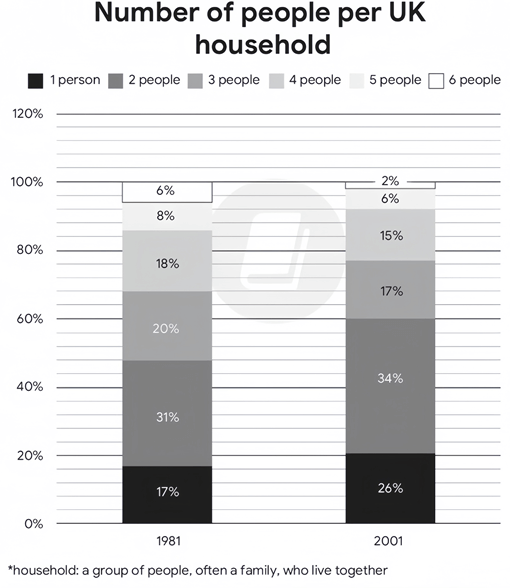
The stacked bar charts give a breakdown of the UK’s household composition in two separate years, namely 1981 and 2001.
Overall, there were decreases in the shares of households having from 3 to 6 people, whereas the converse was true in the case of those having 1 or 2 members, with 2-person and 6-person households being the most and least common in both given years, respectively.
Regarding households with an upward trend, the percentage of 2-member households was consistently the highest, starting at 31% before rising minimally by 3% in the final year. A similar change, but to a greater extent, was observed in the proportion of the smallest-sized households, growing from 17% initially to just over a quarter at the end of the period.
Turning to categories with a downward trend, households with 3 and 4 occupants witnessed the same level of decrease, with their figures dropping from 20% and 18% in 1981 to 17% and 15% two decades later, in that order. 5-person and 6-person households followed similar falling trends, albeit at lower rates. While the figure for the former had declined from 8% to 6% by 2001, that of the latter remained the lowest throughout, dipping from 6% to 2%.
The chart below compares the number of people per household by percentage in the UK - mẫu 2
The two stacked bar charts detail the UK’s household demographics in 1981 and 2001. The initial impression from the chart is that 1-person and 2-person households were the second most and the most common family classifications in both given years, and they also experienced rises in percentages. The remaining groups made up smaller proportions and underwent corresponding drops, with the 6-person household being the least popular one.
In 1981, 2-person household made up 31%, ranking first among the given household type, after which the rate underwent a mild rise to 34% in 2001. A similar picture is evident in 1-person household, with its figure accounting for 17% and thereafter rising to 26% in 2001.
Opposite patterns could be observed with regard to the remaining groups. In 1981 the shares of 3-person, 4-person, 5-person and 6-person were 20%, 18%, 8% and 6% respectively. Over the next 20 years, they all decreased by similar margins (of around 2-3%) to 17%, 15%, 6% and 2%.
The chart below compares the number of people per household by percentage in the UK - mẫu 3
The charts illustrate the percentage of different sized households in the UK, in 1981 and 2001.
Overall, the most common sized household in both measured years was that of 2-person households, while 6-person households were the least common. Additionally, while the percentage of 1-person and 2-person households increased, the percentage of all other sized households decreased.
In 1981, 31% of all households contained 2 people, while 20% of households contained 3 people. 1-person and 4-person households made up similar percentages, at 17% and 18% respectively, whereas 5-person and 6-person households only made up 8% and 6% of the total.
By 2001, the proportion of 1-person and 2-person households had risen to 26% and 34% respectively. Meanwhile, the proportion of all other sized households had decreased, with 3 and 4-person households dropping to similar levels, at 17% and 15% respectively, and 5 and 6-person households dropping to 6% and 2% respectively.
The chart below compares the number of people per household by percentage in the UK - mẫu 4
The stacked bar charts delineate the household compositions with respect to the number of occupants in the UK in 1981 and 2001.
As is shown in the graph, most households in the UK had 2 occupants. Over the surveyed period, single and 2-person households enjoyed upswings whilst other demographics experienced a corresponding downturn.
Regarding the first stacked bar, 31% of households consisted of 2 occupants, heading the list of total demographics. Next came 3-person households with 20%, as opposed to single and 4-member households, accounting for 17% and 18% in turn. Large household sizes ranked in bottom place with 8% for 5-occupant and 6% for 6-occupant units.
20 years later, households with a single person living alone or two persons became dominant, with the figure for the former rising up by 9%, amounting to over one-quarter of total surveyed households. Meanwhile, households with 3 or 4 occupants recorded a fall of 3%, finishing at 17% and 15% respectively. Remaining in the last place were household units of 5 or 6 members, with their figures decreasing to 6% and 2%.
The chart below compares the number of people per household by percentage in the UK - mẫu 5
The stacked bar charts delineate the composition of households in the UK during two distinct years: 1981 and 2001.
Overall, the UK preferred a smaller family size. Throughout both years, households comprising 2 individuals were the most prevalent, while those with 6 members were the least common.
Regarding the escalating trend, 2-person households consistently held the highest percentage, commencing at 31% and experiencing a marginal rise of 3% by the conclusion of the period. A comparable albeit more pronounced upward shift was noticeable in the proportion of the smallest-sized households (1 person), advancing from 17% initially to slightly over 25% by the terminal year.
Conversely, a declining trajectory was evident in households with 3 and 4 inhabitants, both experiencing a reduction from 20% and 18% in 1981 to 17% and 15% respectively by 2001. Similarly, households with 5 and 6 occupants also followed decreasing trends, albeit at slower rates. While the former decreased from 8% to 6% by 2001, the latter consistently demonstrated the lowest representation, plummeting from 6% to a mere 2% over the same period.
The chart below compares the number of people per household by percentage in the UK - mẫu 6
The provided bar graphs compare the number of people per household in the UK in 1981 and 2001, elucidating the dynamic changes of household sizes. Notably, the trend indicates a pivot towards smaller household units over the two decades in question.
Overall, the data presents a clear downsizing trend in UK households, with a notable rise in one and two-person homes and a general decrease in larger family units.
In 1981, two-person households dominated, accounting for 31% of the total, and witnessed a slight increment to 34% by 2001, solidifying their prevalence. Conversely, the smallest household category, one-person units, experienced a significant upsurge from 17% to 26%, marking a move towards more individualised living spaces.
Meanwhile, the more populous household categories all contracted. Four-person homes, which constituted 18% in 1981, retracted to 15% by 2001. Three-person households mirrored this decrease, diminishing from 20% to 17%. Five-person households also saw a reduction, albeit less dramatically, from 8% to 6%. The most pronounced decline was observed in six-person households, which halved from 6% to a mere 2%, marking the most substantial demographic shift.
The chart below compares the number of people per household by percentage in the UK - mẫu 7
The chart elucidates the changes in household composition in the UK, as measured by the number of occupants, between 1981 and 2001.
Overall, there was a noticeable shift towards smaller households in the UK over the 20-year period, with an increase in one and two-person households and a decrease in larger households.
In 1981, two-member households constituted the largest segment, accounting for 31% of the total, and this figure saw a modest rise to 34% in 2001. Single-person households also increased notably, jumping from 17% to 26% over the two decades. Households of three persons experienced a slight decline, from one fifth in 1981 to 17% in 2001.
Contrastingly, larger households displayed a downward trend. In 1981, four-member families accounted for 18% of households, but this fell marginally to 15% in 2001. A similar pattern was observed for five-member households, whose share dropped from 8% to 6% during the same period. Notably, households containing six members were the least common in both years, representing less than 6% of the total.
The chart below compares the number of people per household by percentage in the UK - mẫu 8
The presented chart delineates the evolution of the number of people per household in the UK, by enumerating the number of inhabitants, from 1981 to 2001. It is compelling to note a significant transition towards smaller household units and a concurrent decline in more substantial familial arrangements.
In 1981, the dominant household structure comprised two occupants, accounting for 31% of the total. This segment saw a subtle uptick, reaching 34% by 2001. Singular dwellers also experienced a considerable surge, escalating from 17% to 26% over the two-decade span. The fraction of tri-member households diminished marginally, receding from one fifth in 1981 to 17% by 2001.
In stark contrast, households with larger numbers exhibited a waning trend. Four-member familial units, which represented 18% of total households in 1981, underwent a slight contraction to 15% in 2001. A congruent trajectory was observed amongst five-member households, dwindling from 8% to 6% over the same timeframe. Significantly, households embracing six inhabitants remained the least prevalent category, commanding less than 6% in both surveyed years.
The chart below compares the number of people per household by percentage in the UK - mẫu 9
The given chart depicts the percentages for the number of people living in households over a period of twenty years from 1981 to 2001 in the UK.
Overall, the percentage of families with 1 to two members increased, while the proportion of families with 3 or more people decreased slightly. In addition, two person households account for the largest percentage of households, whereas six person households have the lowest percentage.
In 1981, the number of households with 2-person accounted for 31% and ranked first among the households, after which it witnessed a slight increase to 34% in 2001. Furthermore, the number of single-person households was responsible for 17%, which was followed by a significant increase of 26% in the next two decades.
Turning to households with a downward trend, the number of households with 3-person decreased slightly by 3% from 20% to 17% and households with 4-person witnessed the same level of decrease with their figures dropping from 18% to 15% over the following two decades. Remain in the last place are households of 5 and 6-person who also have a similar decrease with the rate falling to 6% and 2% respectively.
The chart below compares the number of people per household by percentage in the UK - mẫu 10
The bar chart depicts the distribution of households in the UK based on their size in the years 1981 and 2001.
Overall, households consisting of two individuals were the most prevalent category in both years, whereas households with six members were the least common. Furthermore, while the percentage of one-person and two-person households witnessed an upward shift, the proportion of households of other sizes took the opposite trend.
In 1981, approximately 31% of all households comprised two people, while 20% were composed of three individuals. One-person and four-person households accounted for similar proportions, at 17% and 18% respectively, whereas five-person and six-person households constituted only 8% and 6% of the total in that order.
After 20 years, the percentage of one-person households rose considerably to 26%, representing a significant increase of 9%. The proportion of those with two people followed a similar pattern, although the increase was less pronounced, with a 3% rise. Meanwhile, the trend for the remaining categories was downward, as their figures decreased by around 2 to 4%.
Xem thêm các bài luận Tiếng Anh hay khác:

TÀI LIỆU CLC DÀNH CHO GIÁO VIÊN VÀ PHỤ HUYNH LỚP 9
+ Bộ giáo án, bài giảng powerpoint, đề thi file word có đáp án 2025 tại https://tailieugiaovien.com.vn/
+ Hỗ trợ zalo: VietJack Official
+ Tổng đài hỗ trợ đăng ký : 084 283 45 85
Đã có app VietJack trên điện thoại, giải bài tập SGK, SBT Soạn văn, Văn mẫu, Thi online, Bài giảng....miễn phí. Tải ngay ứng dụng trên Android và iOS.


Nếu thấy hay, hãy động viên và chia sẻ nhé! Các bình luận không phù hợp với nội quy bình luận trang web sẽ bị cấm bình luận vĩnh viễn.
- Đề thi lớp 1 (các môn học)
- Đề thi lớp 2 (các môn học)
- Đề thi lớp 3 (các môn học)
- Đề thi lớp 4 (các môn học)
- Đề thi lớp 5 (các môn học)
- Đề thi lớp 6 (các môn học)
- Đề thi lớp 7 (các môn học)
- Đề thi lớp 8 (các môn học)
- Đề thi lớp 9 (các môn học)
- Đề thi lớp 10 (các môn học)
- Đề thi lớp 11 (các môn học)
- Đề thi lớp 12 (các môn học)
- Giáo án lớp 1 (các môn học)
- Giáo án lớp 2 (các môn học)
- Giáo án lớp 3 (các môn học)
- Giáo án lớp 4 (các môn học)
- Giáo án lớp 5 (các môn học)
- Giáo án lớp 6 (các môn học)
- Giáo án lớp 7 (các môn học)
- Giáo án lớp 8 (các môn học)
- Giáo án lớp 9 (các môn học)
- Giáo án lớp 10 (các môn học)
- Giáo án lớp 11 (các môn học)
- Giáo án lớp 12 (các môn học)


 Giải bài tập SGK & SBT
 Tài liệu giáo viên
 Sách
Sách
 Khóa học
 Thi online
 Hỏi đáp