
5+ The charts below show the water levels of 6 cities in Australia in October 2009 and 2010
The charts below show the water levels of 6 cities in Australia in October 2009 and 2010. Summarise the information by selecting and reporting the main features, and make comparisons where relevant. Write at least 150 words hay nhất giúp bạn có thêm tài liệu tham khảo để viết bài luận bằng Tiếng Anh hay hơn.
- The charts below show the water levels of 6 cities in Australia in October 2009 and 2010 (mẫu 1)
- The charts below show the water levels of 6 cities in Australia in October 2009 and 2010 (mẫu 2)
- The charts below show the water levels of 6 cities in Australia in October 2009 and 2010 (mẫu 3)
- The charts below show the water levels of 6 cities in Australia in October 2009 and 2010 (mẫu 4)
5+ The charts below show the water levels of 6 cities in Australia in October 2009 and 2010
Đề bài: The charts below show the water levels of 6 cities in Australia in October 2009 and 2010. Summarise the information by selecting and reporting the main features, and make comparisons where relevant. Write at least 150 words
The charts below show the water levels of 6 cities in Australia in October 2009 and 2010 - mẫu 1
The presented bar chart illustrates the variations in water levels across six Australian cities during October 2009 and 2010.
Overall, the majority of the surveyed cities witnessed an upward trend in the water levels in the reservoirs in October 2010 compared to the preceding year. The only two exceptions were Darwin, where the water level decreased, and Brisbane which recorded no change. In addition, Canberra was the city with the highest percentage of water stored in its reservoirs in both years.
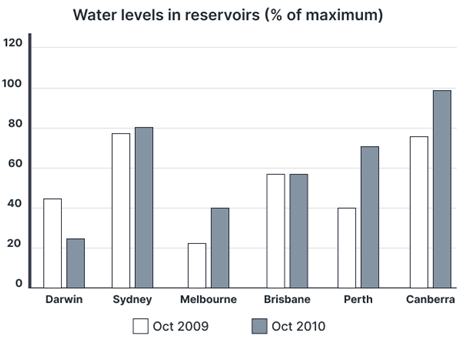
In October 2009, Sydney and Canberra had the most abundant water reserves, with approximately 75% water capacity each. Brisbane, Darwin, and Perth followed, registering figures ranging from 40% to approximately 55%. In contrast, Melbourne recorded the lowest water percentage in its reservoirs, hovering around 25%.
One year later, Perth witnessed the largest increase in water levels, hitting a high of just above 70%. Having a similar trend, the figure for Canberra reached a peak of nearly 100%, making it the city with the highest level of water. Although Sydney and Melbourne also experienced upward trends, their growth was less pronounced, with respective figures in 2010 of 80% and 40%. Conversely, Darwin encountered a notable decline in its reservoir water, decreasing to just under 30% of its capacity in October 2010. Finally, the figure for Brisbane remained unchanged compared to the previous year.
The charts below show the water levels of 6 cities in Australia in October 2009 and 2010 - mẫu 2
The bar chart illustrates the changes in the levels of water in reservoirs across six Australian urban areas between October 2009 and the same month in 2010.
Overall, the water level in Darwin decreased over the period in question, whereas the opposite was true in the case of the other cities, except for Brisbane, where no changes were recorded. Additionally, Canberra had replaced Sydney to become the city with the highest percentage of water stored in its reservoir by the end of the period.
In October 2009, Sydney and Canberra had more water at their disposal than any other city listed, as around 75% of their reservoir levels were filled. These metropolises were followed by Brisbane, Darwin, and Perth, with their figures ranging from 40% to nearly 60%. In the last position was Melbourne, whose water reservoir was just over a fifth full.
After one year, the capital city took the lead, with its water level increasing to a high of close to 100% of the total storage capacity. Sydney and Melbourne followed similar trends, albeit at lower rates, rising to 80% and 40%, respectively. The largest rise was seen in the proportion of water stored in Perth’s reservoir, reaching approximately 70%. This contrasts starkly with the data for Darwin, where a fall to roughly 25% was reported, and lastly, the figure for Brisbane stayed the same.
The charts below show the water levels of 6 cities in Australia in October 2009 and 2010 - mẫu 3
The bar chart delineates the fluctuations in water levels within reservoirs across six urban regions in Australia from October 2009 to the corresponding month in 2010.
Across the period, Darwin experienced a decline in water reserves, while the other cities observed an increase, except Brisbane, where no alterations were evident. Notably, Canberra surpassed Sydney to secure the position of the city with the highest water storage percentage in its reservoirs by the end of the period.
In October 2009, Sydney and Canberra boasted the highest water storage among the listed cities, with both locations holding approximately 75% of their reservoir capacities. Following them were Brisbane, Darwin, and Perth, maintaining levels varying from 40% to nearly 60%. Melbourne recorded the lowest water reserves, barely exceeding a fifth of its storage capacity.
Over the course of the year, Canberra ascended to the forefront, with its reservoirs reaching nearly 100% capacity. Meanwhile, Sydney and Melbourne exhibited growth, albeit at slower rates, achieving 80% and 40%, respectively. Perth demonstrated the most substantial rise, with its water reserves escalating to around 70%. In contrast, Darwin experienced a sharp drop to approximately 25%. Brisbane’s water storage level remained constant throughout the duration.
The charts below show the water levels of 6 cities in Australia in October 2009 and 2010 - mẫu 4
The bar graph illustrates the percentage of the water levels of October 2009 to October 2010 compared to the maximum water levels in reservoirs in six Australian cities.
As can be seen from the graph, the proportion of water levels in comparison with the maximum levels at the city's reservoirs after a year from October 2009 rose in four cities. In particular, in Sydney and Canberra, numbers increased from 75%, the highest level of the year in these two cities in 2009 to over 80% and to around 98% respectively in 2010. That proportion in Canberra was also the highest data across the chart. As for Perth, the number lifted from about 40% to over 60% after a year while in Melbourne, water in reservoirs went up from the lowest level of 25% in October 2009 to around 37% in 2010 to escape the trough of the list.
However, water levels dropped in Darwin, falling from 45% in October 2009 to under 30% after a year and pushed this city to the bottom of the league. Meanwhile, Brisbane enjoyed the stability in the water level at 55% of the top level in their reservoirs over the period.
Overall, water level increased in four cities, fell in one, and stabilized in the other. Besides, Canberra and Sydney had the most abundant water source of all in the period.
Xem thêm các bài luận Tiếng Anh hay khác:

TÀI LIỆU CLC DÀNH CHO GIÁO VIÊN VÀ PHỤ HUYNH LỚP 9
+ Bộ giáo án, bài giảng powerpoint, đề thi file word có đáp án 2025 tại https://tailieugiaovien.com.vn/
+ Hỗ trợ zalo: VietJack Official
+ Tổng đài hỗ trợ đăng ký : 084 283 45 85
Đã có app VietJack trên điện thoại, giải bài tập SGK, SBT Soạn văn, Văn mẫu, Thi online, Bài giảng....miễn phí. Tải ngay ứng dụng trên Android và iOS.


Nếu thấy hay, hãy động viên và chia sẻ nhé! Các bình luận không phù hợp với nội quy bình luận trang web sẽ bị cấm bình luận vĩnh viễn.
- Đề thi lớp 1 (các môn học)
- Đề thi lớp 2 (các môn học)
- Đề thi lớp 3 (các môn học)
- Đề thi lớp 4 (các môn học)
- Đề thi lớp 5 (các môn học)
- Đề thi lớp 6 (các môn học)
- Đề thi lớp 7 (các môn học)
- Đề thi lớp 8 (các môn học)
- Đề thi lớp 9 (các môn học)
- Đề thi lớp 10 (các môn học)
- Đề thi lớp 11 (các môn học)
- Đề thi lớp 12 (các môn học)
- Giáo án lớp 1 (các môn học)
- Giáo án lớp 2 (các môn học)
- Giáo án lớp 3 (các môn học)
- Giáo án lớp 4 (các môn học)
- Giáo án lớp 5 (các môn học)
- Giáo án lớp 6 (các môn học)
- Giáo án lớp 7 (các môn học)
- Giáo án lớp 8 (các môn học)
- Giáo án lớp 9 (các môn học)
- Giáo án lớp 10 (các môn học)
- Giáo án lớp 11 (các môn học)
- Giáo án lớp 12 (các môn học)


 Giải bài tập SGK & SBT
 Tài liệu giáo viên
 Sách
Sách
 Khóa học
 Thi online
 Hỏi đáp