
5+ The graph below shows the amounts of waste produced by three companies over a period of 15 years
The graph below shows the amounts of waste produced by three companies over a period of 15 years. Summarise the information by selecting and reporting the main features, and make comparisons where relevant. Write at least 150 words hay nhất giúp bạn có thêm tài liệu tham khảo để viết bài luận bằng Tiếng Anh hay hơn.
- The graph below shows the amounts of waste produced by three companies over a period of 15 years (mẫu 1)
- The graph below shows the amounts of waste produced by three companies over a period of 15 years (mẫu 2)
- The graph below shows the amounts of waste produced by three companies over a period of 15 years (mẫu 3)
- The graph below shows the amounts of waste produced by three companies over a period of 15 years (mẫu 4)
- The graph below shows the amounts of waste produced by three companies over a period of 15 years (mẫu 5)
- The graph below shows the amounts of waste produced by three companies over a period of 15 years (mẫu 6)
5+ The graph below shows the amounts of waste produced by three companies over a period of 15 years
Đề bài: The graph below shows the amounts of waste produced by three companies over a period of 15 years. Summarise the information by selecting and reporting the main features, and make comparisons where relevant. Write at least 150 words.
The graph below shows the amounts of waste produced by three companies over a period of 15 years - mẫu 1
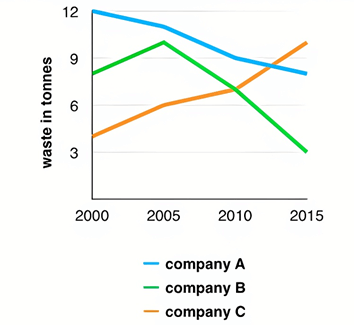
The line graph provides a comparative analysis of waste production by three companies over a 15-year duration, spanning from 2000 to 2015.
Evidently, notable shifts occurred in the waste output of the depicted companies. Companies A and B observed a decline in waste production over the 15-year period, whereas Company C exhibited a substantial increase.
In the year 2000, Company A generated 12 tonnes of waste, while Companies B and C produced approximately 8 tonnes and 4 tonnes, respectively. Over the subsequent five years, Companies B and C experienced a marginal increase of around 2 tonnes each, while Company A’s waste output decreased by approximately 1 tonne.
From 2005 to 2015, Company A further reduced its waste production by approximately 3 tonnes, reflecting a continuous downward trend. Company B demonstrated a more significant reduction, slashing its waste by around 7 tonnes during the same period. In stark contrast, Company C witnessed a notable surge in waste production, increasing by approximately 4 tonnes over the 10-year span. By 2015, Company C’s waste output peaked at 10 tonnes, while Companies A and B saw further reductions, reaching 8 tonnes and 3 tonnes, respectively.
The graph below shows the amounts of waste produced by three companies over a period of 15 years - mẫu 2
The line graph compares three companies in terms of their waste output between the years 2000 and 2015.
It is clear that there were significant changes in the amounts of waste produced by all three companies shown on the graph. While companies A and B saw waste output fall over the 15-year period, the amount of waste produced by company C increased considerably.
In 2000, company A produced 12 tonnes of waste, while companies B and C produced around 8 tonnes and 4 tonnes of waste material respectively. Over the following 5 years, the waste output of companies B and C rose by around 2 tonnes, but the figure for company A fell by approximately 1 tonne.
From 2005 to 2015, company A cut waste production by roughly 3 tonnes, and company B reduced its waste by around 7 tonnes. By contrast, company C saw an increase in waste production of approximately 4 tonnes over the same 10-year period. By 2015, company C’s waste output had risen to 10 tonnes, while the respective amounts of waste from companies A and B had dropped to 8 tonnes and only 3 tonnes.
The graph below shows the amounts of waste produced by three companies over a period of 15 years - mẫu 3
The given line chart portrays almost all the wastage produced by three organizations from 2000 to 2015. Generally, company A and B diminished their squander fabric whereas company C created more futile materials amid the given time period.
The start with 2000 institution C produced nearly 4 tons of squander items while company B created twofold futile things and for company A the generation of wastage was three-fold. In another five a long time, organizations B and C took after the upward slant and came to almost 10 and 6 separately. At the interim company A adjusted the descending slant and came down 1 tone
Moreover, within the other ten a long time and B diminished their waste generation and within the last year finished at around 8 and 3 appropriately. While the futile materials of Company C slanted and drawn nearer nearly 10 within the final year.
The graph below shows the amounts of waste produced by three companies over a period of 15 years - mẫu 4
The chart shows the amounts of squander delivered compared by three distinctive companies over 15 a long time. In general, it is evident to see that within the third given age, workplaces A and B have an altogether diminished rate, whereas company C still has an expanded rate also. To start with, firm C encompasses a drift to grow each year; particularly in 2015, which contains a greater than the period some time recently which is near to 12 tons. In any case, the biggest rise course of venture B is within. The figure in 2005 was around 10 loads. In differentiation, within the minute of 2000 is greatest add up to of enterprises is fair as it were 12 bounties.
On the other hand, in 2015 both affiliations A and B had a drop rate of roughly 3-10, as company A slowly diminished for the primary year loads in the meantime, the lower development of firm C began minute by minute with a brief 4 tons.
The graph below shows the amounts of waste produced by three companies over a period of 15 years - mẫu 5
The line graph shows information about the waste outputs that were generated by three different companies from 2000 to 2015.
Overall, it is true that there were considerable changes in the amounts of waste produced by all three companies over the period shown. While the figures for companies A and B decreased dramatically over the period of 15 years, company C experienced the greatest growth in its waste production.
In 2000, company A produced 12 tonnes of waste, compared to 8 tonnes of company B and 4 tonnes of company C. Over the next 5 years, waste generation from company A dropped to 11 tonnes in 2005, whereas the waste totals of companies B and C went up by 2 tonnes.
A slight increase of about 1 tonne in the amount of waste generated by company C was recorded between 2005 and 2010. By contrast, companies A and B reduced their figures by 2 tonnes and 3 tonnes respectively over the same period. From 2010 to 2015, the amount of waste from company C grew sharply, reaching 10 tonnes by 2015. Meanwhile, companies A and B saw their waste outputs rise to 8 tonnes and 3 tonnes by the end of the period.
The graph below shows the amounts of waste produced by three companies over a period of 15 years - mẫu 6
The given line graph gives information about the production of waste of three companies between 2000 and 2015.
The amounts of waste of company A and B decreased significantly from 2000 and 2015. Besides, the production of company C increased significantly over the same time period.
In 2000, company A accounted for the large number of wastes with 12 tonnes, followed by company B with nearly 9 tonnes, and company C was over 3 tonnes. In the next five years, while the wasted products were reduced by company A to nearly 11 tonnes, in contrast, company Band C rose this numbers to 10 tonnes and 6 tonnes, respectively.
From 2005 to 2010, company A and company B cut wasted production by roughly 3 tonnes, company C continually increased to around 7 tonnes. In the year 2015, wasted products of company A and B dropped to 8 and 3, this number in company C was risen to over 10 tonnes.
Xem thêm các bài luận Tiếng Anh hay khác:

TÀI LIỆU CLC DÀNH CHO GIÁO VIÊN VÀ PHỤ HUYNH LỚP 9
+ Bộ giáo án, bài giảng powerpoint, đề thi file word có đáp án 2025 tại https://tailieugiaovien.com.vn/
+ Hỗ trợ zalo: VietJack Official
+ Tổng đài hỗ trợ đăng ký : 084 283 45 85
Đã có app VietJack trên điện thoại, giải bài tập SGK, SBT Soạn văn, Văn mẫu, Thi online, Bài giảng....miễn phí. Tải ngay ứng dụng trên Android và iOS.


Nếu thấy hay, hãy động viên và chia sẻ nhé! Các bình luận không phù hợp với nội quy bình luận trang web sẽ bị cấm bình luận vĩnh viễn.
- Đề thi lớp 1 (các môn học)
- Đề thi lớp 2 (các môn học)
- Đề thi lớp 3 (các môn học)
- Đề thi lớp 4 (các môn học)
- Đề thi lớp 5 (các môn học)
- Đề thi lớp 6 (các môn học)
- Đề thi lớp 7 (các môn học)
- Đề thi lớp 8 (các môn học)
- Đề thi lớp 9 (các môn học)
- Đề thi lớp 10 (các môn học)
- Đề thi lớp 11 (các môn học)
- Đề thi lớp 12 (các môn học)
- Giáo án lớp 1 (các môn học)
- Giáo án lớp 2 (các môn học)
- Giáo án lớp 3 (các môn học)
- Giáo án lớp 4 (các môn học)
- Giáo án lớp 5 (các môn học)
- Giáo án lớp 6 (các môn học)
- Giáo án lớp 7 (các môn học)
- Giáo án lớp 8 (các môn học)
- Giáo án lớp 9 (các môn học)
- Giáo án lớp 10 (các môn học)
- Giáo án lớp 11 (các môn học)
- Giáo án lớp 12 (các môn học)


 Giải bài tập SGK & SBT
 Tài liệu giáo viên
 Sách
Sách
 Khóa học
 Thi online
 Hỏi đáp