
5+ The graph below shows the average house prices in 3 countries between the years 1997-2014
The graph below shows the average house prices in 3 countries between the years 1997-2014. Summarise the information by selecting and reporting the main features, and make comparisons where relevant. Write at least 150 words hay nhất giúp bạn có thêm tài liệu tham khảo để viết bài luận bằng Tiếng Anh hay hơn.
5+ The graph below shows the average house prices in 3 countries between the years 1997-2014
Đề bài: The graph below shows the average house prices in 3 countries between the years 1997-2014. Summarise the information by selecting and reporting the main features, and make comparisons where relevant. Write at least 150 words
The graph below shows the average house prices in 3 countries between the years 1997-2014 - mẫu 1
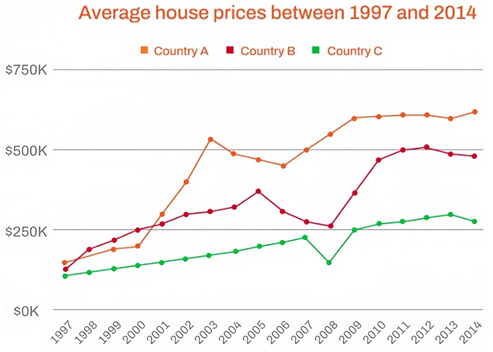
The graph demonstrates the average house prices in three countries, A, B, and C, from 1997 to 2014.
Over the time period, average housing prices in all three countries had generally climbed. Additionally, for the vast majority of the period, country A’s average house cost was greater than those of countries B and C.
Country A’s average property cost increased considerably from $130K in 1997 to $510K in 2003. Housing prices, however, witnessed a minor fall of $80K between 2003 and 2006, followed by a gradual recovery until 2014, when prices peaked at $625K.
In 1997, the average property price in countries B and C was approximately $125,000. Yet, by 2005, the average house price in country B rose to around $375K, whereas prices in country C only increased to around $250K by 2007. Prices in nation B were markedly lower from 2005 to 2008, then significantly higher until 2012, when prices fell to roughly $500K at the end of the period. Likewise, prices in country C declined until 2008, then climbed steadily until 2013 after slightly dropping to roughly $260K.
The graph below shows the average house prices in 3 countries between the years 1997-2014 - mẫu 2
The line graph depicts the average property prices in three nations, A, B, and C, from 1997 to 2014.
Overall, throughout the period, the average house price in each of the three nations increased but with some fluctuations. In addition, in most years, nation A had the highest figure.
In 1997, country A had the most expensive house price (around $180k). The following year, country B overtook country A’s position and was the first to reach $250k in 2000. However, just a year later, country A regained its top 1 rank and remained in this position for the remaining period. From 1997 to 2007, all countries had upward trends, but country A peaked in 2003 (around $530k) while country B peaked in 2005 (around $350k).
In 2008, countries B and C substantially dropped to $260k and $180k, respectively, before climbing back in 2009. Approaching 2014, all 3 countries hit their new high records approximately in 2012 and 2013. In 2014, countries A, B, and C ultimately finished at roughly $625k, $500k, and $260k, respectively.
The graph below shows the average house prices in 3 countries between the years 1997-2014 - mẫu 3
The line chart illustrates variations in average house prices in Countries A, B and C from 1997 to 2014. Overall, house prices in all the countries experienced an upward trend, with houses in Country A being the most expensive by the end of the period. Also noticeable is that housing prices in Country B had a similar pattern to Country C albeit always higher.
Looking initially at Country A, although house prices started the highest at about $140000, they were overtaken by Country B in 1998, but soon regained the leading status after 2 years. From 2000, prices soared almost continually, reaching a high point of roughly $625000 in 2014, despite a notable dip from 2002 through to 2006.
Regarding housing prices in Country B and C, both maintained relatively stable growth throughout. The prices in these countries both began at approximately $125000, but since 1998, the gap started to widen. Country B rose dramatically, reaching its high of just over $500000 in 2012 while the other country peaked at about $300000 in 2013. Interestingly, both countries saw a huge drop in 2008 and a marginal decline at the end of the period.
Xem thêm các bài luận Tiếng Anh hay khác:

TÀI LIỆU CLC DÀNH CHO GIÁO VIÊN VÀ PHỤ HUYNH LỚP 9
+ Bộ giáo án, bài giảng powerpoint, đề thi file word có đáp án 2025 tại https://tailieugiaovien.com.vn/
+ Hỗ trợ zalo: VietJack Official
+ Tổng đài hỗ trợ đăng ký : 084 283 45 85
Đã có app VietJack trên điện thoại, giải bài tập SGK, SBT Soạn văn, Văn mẫu, Thi online, Bài giảng....miễn phí. Tải ngay ứng dụng trên Android và iOS.


Nếu thấy hay, hãy động viên và chia sẻ nhé! Các bình luận không phù hợp với nội quy bình luận trang web sẽ bị cấm bình luận vĩnh viễn.
- Đề thi lớp 1 (các môn học)
- Đề thi lớp 2 (các môn học)
- Đề thi lớp 3 (các môn học)
- Đề thi lớp 4 (các môn học)
- Đề thi lớp 5 (các môn học)
- Đề thi lớp 6 (các môn học)
- Đề thi lớp 7 (các môn học)
- Đề thi lớp 8 (các môn học)
- Đề thi lớp 9 (các môn học)
- Đề thi lớp 10 (các môn học)
- Đề thi lớp 11 (các môn học)
- Đề thi lớp 12 (các môn học)
- Giáo án lớp 1 (các môn học)
- Giáo án lớp 2 (các môn học)
- Giáo án lớp 3 (các môn học)
- Giáo án lớp 4 (các môn học)
- Giáo án lớp 5 (các môn học)
- Giáo án lớp 6 (các môn học)
- Giáo án lớp 7 (các môn học)
- Giáo án lớp 8 (các môn học)
- Giáo án lớp 9 (các môn học)
- Giáo án lớp 10 (các môn học)
- Giáo án lớp 11 (các môn học)
- Giáo án lớp 12 (các môn học)


 Giải bài tập SGK & SBT
 Tài liệu giáo viên
 Sách
Sách
 Khóa học
 Thi online
 Hỏi đáp