
5+ The line graphs show the percentage of people using public transport and people using
The line graphs show the percentage of people using public transport and people using private cars in five cities of Australia from 2000 to 2010. Summarise the information by selecting and reporting the main features, and make comparisons where relevant. Write at least 150 words hay nhất giúp bạn có thêm tài liệu tham khảo để viết bài luận bằng Tiếng Anh hay hơn.
5+ The line graphs show the percentage of people using public transport and people using
Đề bài: The line graphs show the percentage of people using public transport and people using private cars in five cities of Australia from 2000 to 2010. Summarise the information by selecting and reporting the main features, and make comparisons where relevant. Write at least 150 words
The line graphs show the percentage of people using public transport and people using - mẫu 1
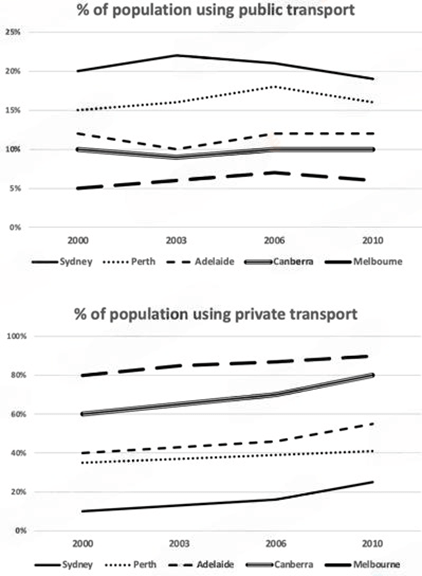
The line graphs compare the changes in the proportion of people who used public and private transport in five Australian cities, during a decade between 2000 and 2010.
Overall, in all five cities, a larger percentage of people preferred private transport by 2010, and the greatest disparity can be found in Melbourne.
The percentages of public transport use in 2000 and 2010 were roughly the same in all the given areas, among which Sydney had the largest (about 20%), followed by Perth (around 15%), Adelaide (approximately 12%), Canberra (10%) and Melbourne (slightly more than 5%). Despite that, there were various ups and downs during the period. While the proportion in Sydney peaked at about 22% in 2003, the figure for Adelaide bottomed out at 10% in the same year, after which the former demonstrated a continuous decline, whereas the latter showed a slight increase. The rates in Perth and Melbourne reached their high points in around 2006, at nearly 18% and 7% respectively.
In terms of private vehicles, Melbourne and Canberra had the largest and the second largest user groups, at 80% and 60% respectively, and the former augmented by 10%, while the latter by 20%. In Adelaide and Perth, albeit a similar proportion in 2000 at 40%, a swifter growth was found in the former after 2006, approaching 60% by 2010. By contrast, only 10% of citizens in Sydney utilized private transport in 2000, although by 2010, this percentage had more than doubled to approximately 22%.
Xem thêm các bài luận Tiếng Anh hay khác:

TÀI LIỆU CLC DÀNH CHO GIÁO VIÊN VÀ PHỤ HUYNH LỚP 9
+ Bộ giáo án, bài giảng powerpoint, đề thi file word có đáp án 2025 tại https://tailieugiaovien.com.vn/
+ Hỗ trợ zalo: VietJack Official
+ Tổng đài hỗ trợ đăng ký : 084 283 45 85
Đã có app VietJack trên điện thoại, giải bài tập SGK, SBT Soạn văn, Văn mẫu, Thi online, Bài giảng....miễn phí. Tải ngay ứng dụng trên Android và iOS.


Nếu thấy hay, hãy động viên và chia sẻ nhé! Các bình luận không phù hợp với nội quy bình luận trang web sẽ bị cấm bình luận vĩnh viễn.
- Đề thi lớp 1 (các môn học)
- Đề thi lớp 2 (các môn học)
- Đề thi lớp 3 (các môn học)
- Đề thi lớp 4 (các môn học)
- Đề thi lớp 5 (các môn học)
- Đề thi lớp 6 (các môn học)
- Đề thi lớp 7 (các môn học)
- Đề thi lớp 8 (các môn học)
- Đề thi lớp 9 (các môn học)
- Đề thi lớp 10 (các môn học)
- Đề thi lớp 11 (các môn học)
- Đề thi lớp 12 (các môn học)
- Giáo án lớp 1 (các môn học)
- Giáo án lớp 2 (các môn học)
- Giáo án lớp 3 (các môn học)
- Giáo án lớp 4 (các môn học)
- Giáo án lớp 5 (các môn học)
- Giáo án lớp 6 (các môn học)
- Giáo án lớp 7 (các môn học)
- Giáo án lớp 8 (các môn học)
- Giáo án lớp 9 (các môn học)
- Giáo án lớp 10 (các môn học)
- Giáo án lớp 11 (các môn học)
- Giáo án lớp 12 (các môn học)


 Giải bài tập SGK & SBT
 Tài liệu giáo viên
 Sách
Sách
 Khóa học
 Thi online
 Hỏi đáp