
5+ The table and pie chart give information about the population in Australia according
The table and pie chart give information about the population in Australia according to different nationalities and areas. Summarise the information by selecting and reporting the main features, and make comparisons where relevant. Write at least 150 words hay nhất giúp bạn có thêm tài liệu tham khảo để viết bài luận bằng Tiếng Anh hay hơn.
- The table and pie chart give information about the population in Australia according (mẫu 1)
- The table and pie chart give information about the population in Australia according (mẫu 2)
- The table and pie chart give information about the population in Australia according (mẫu 3)
- The table and pie chart give information about the population in Australia according (mẫu 4)
- The table and pie chart give information about the population in Australia according (mẫu 5)
- The table and pie chart give information about the population in Australia according (mẫu 6)
- The table and pie chart give information about the population in Australia according (mẫu 7)
- The table and pie chart give information about the population in Australia according (mẫu 8)
- The table and pie chart give information about the population in Australia according (mẫu 9)
- The table and pie chart give information about the population in Australia according (mẫu 10)
- The table and pie chart give information about the population in Australia according (mẫu 11)
- The table and pie chart give information about the population in Australia according (mẫu 12)
5+ The table and pie chart give information about the population in Australia according
Đề bài: The table and pie chart give information about the population in Australia according to different nationalities and areas. Summarise the information by selecting and reporting the main features, and make comparisons where relevant. Write at least 150 words
The table and pie chart give information about the population in Australia according - mẫu 1
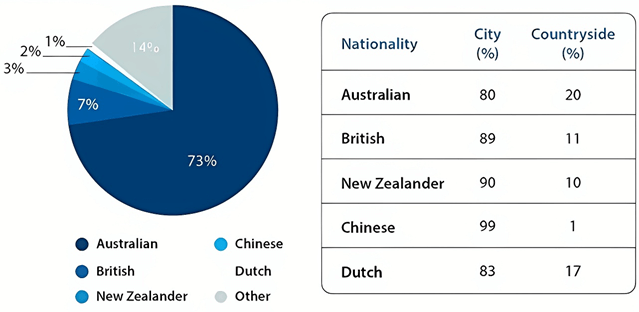
The pie chart gives information on the percentages of people from different countries who live in Australia while the table illustrates the proportions of inhabitants in rural and urban areas.
Looking from an overall perspective, the most striking feature of the pie chart is the predominance of native Australians living in this country. Regarding the table, it is apparent that the vast majority of people, regardless of their nationality, choose to live in cities.
In terms of the pie chart, Australians account for nearly three-quarters of the population in this country, which is almost ten times as large as the segment of people from Britain residing in Australia. New Zealand ranks third, at 3 percent, followed by China and the Netherlands, at 2 percent and 1 percent respectively while 14 percent of the Australian population is made up of residents from other countries.
Regarding their living areas, although the percentage of Australians living in rural areas is the highest among all demographics, at 20 percent, the majority of them still live in cities. A similar pattern can be observed in the figures for the Dutch, the British and New Zealanders with 83 per cent, 89 per cent and 90 percent of them opting for urban areas. Almost all Chinese residents live in these parts of the country (99 percent).
The table and pie chart give information about the population in Australia according - mẫu 2
The given pie chart illustrates the percentage of people of different nationalities residing in Australia, whereas the table shows demographical figures which are classified according to urban and rural areas. The initial impression from the pie chart is that the vast majority of Australian people claim their ancestry to be of Australian origin. It is also noticeable that most Australian people, regardless of their ethnicity, are city dwellers.
According to the pie chart, Australian ethnicity makes up nearly three fourths of the total population. This is followed by the figure for people coming from the UK (7%) and New Zealand (3%). People of Chinese and Dutch ethnicity, on the other hand, made up a negligible 1-2%.
As is seen from the table, roughly 80% of people from Australia and New Zealand live in cities, whereas only around 20% lived in the countryside. A similar picture is evident in the figures for people from China and New Zealand, with their urban population amounting to a high of 90-99%.
The table and pie chart give information about the population in Australia according - mẫu 3
The given pie chart illustrates the percentages of different nationalities that make up the Australian population, while the table gives information about whether they live in urban or rural areas.
In general, it is evident that the vast majority of Australia’s population is of Australian nationality. Furthermore, most people in this country, irrespective of their nationality, opt to live in cities.
The percentage of the Australian population that are of Australian nationality is 73%, whereas the figures for people of British or other nationalities are significantly lower, at 7% and 14% respectively. Meanwhile, 3% of the population come from New Zealand, while 2% are of Chinese nationality. 1% of Australia’s population comes from the Netherlands.
From the table it can be seen that 80% of Australians choose to reside in cities, along with 89% of the British and 90% of the New Zealanders. Similarly, 99% of Chinese live in the city, as do 83% of the Dutch.
The table and pie chart give information about the population in Australia according - mẫu 4
The pie chart depicts the constitution of those residing in Australia with respect to their nationalities, whereas the table details where these people live in an unspecified year.
Overall, what stands out from the graph is that Australian demographics hold the lion’s share in the population of this nation. Another interesting point is that most residents opt for the city regardless of ethnicity.
With regards to the pie chart, local Australian people represent nearly three fourths (73%) of the total population. Next came other countries with 14%, whilst 7% come from the UK. Those whose home countries are in Dutch, China and New Zealand hold a negligible 1-3% of total people residing in Australia.
In terms of the table, the vast majority of surveyed Australian demographics favour living in the city with 8 out of 10. A similar pattern can be seen in the figures for Dutch, British and New Zealander residents, amounting to 83%, 89% and 90% respectively. This trend is particularly evident in Chinese people with 99% choosing to live in the city.
The table and pie chart give information about the population in Australia according - mẫu 5
The pie chart and table detail population figures in Australia and if residents tended to live in rural or urban areas. Looking from an overall perspective, it is readily apparent that the vast majority of the population is Australian, followed by sizeable numbers for other and British nationals, and more marginal figures for New Zealanders, Chinese, and the Dutch. All demographics live overwhelmingly in cities, especially individuals from China.
The pie chart indicates that 73% of the Australian population is made up of Australians themselves. This figure is followed distantly by other at 14%, residents from Great Britain at 7%, New Zealanders at 3%, Chinese at 2%, and people from the Netherlands at just 1%.
In terms of livings areas, Australians are most likely to live outside cities, though 80% still live in urban environments. Similarly, 83% of the Dutch live in cities and 17% in the countryside. British and New Zealand residents display nearly identical proportions with around 90% in cities. Finally, the Chinese live predominately in the cities (99%).
The table and pie chart give information about the population in Australia according - mẫu 6
The pie chart illustrates a demographic breakdown of the Australian population by nationality, and the table shows the proportions of these nationalities living in urban and rural areas.
Overall, Australian nationals are the predominant group in the entire country. In addition, the vast majority of the population gravitates towards city life regardless of their nationalities, with nearly the entire Chinese immigrant community doing so.
Looking first at the different nationalities, nearly three quarters (73%) of the population are Australian, which is more than ten times higher than the figure for British people, at 7%. Meanwhile, New Zealanders, Chinese, and Dutch nationals are also smaller minorities, with their respective figures being 3%,2% and 1%, and all other unnamed nationalities account for 14%.
Regarding the locations of these communities, almost all Chinese people reside in cities, specifically 99%. Similarly, the majority of people from the UK and New Zealand live in urban areas, at 89% and 90% respectively. Finally, 83% of people originating from the Netherlands have settled and remained in cities, which is only 3% more than that of Australians.
The table and pie chart give information about the population in Australia according - mẫu 7
The pie chart depicts the percentage of people of various nationalities living in Australia, whereas the table displays demographic data divided into urban and rural areas.
Overall, the pie chart gives the impression that the vast majority of Australians claim to have ancestors of Australian origin. It is also notable from the table that most Australians, regardless of ethnicity, are urban dwellers.
According to the pie chart, ethnicity accounts for nearly three-quarters of the total population in Australia. This is followed by figures for people from the United Kingdom (7%), and New Zealand (3%). People of Chinese and Dutch origin, on the other hand, made up a negligible 1-2% of the population.
Looking at the table, roughly 80% of Australians and New Zealanders live in cities, with only about 20% living in the countryside. A similar picture can be seen in the figures for people from China and New Zealand, where the urban population is 90-99%.
The table and pie chart give information about the population in Australia according - mẫu 8
The given pie chart shows the percentage of people of different nationalities residing in Australia, while the table shows demographic figures which are classified according to urban and rural areas.
Overall, Australians are the largest nationalities, residents, almost three-quarters of the major population, and they tend to live in the urban area. This figure is followed distantly by other citizens who are almost twice the residents from Great Britain (7%), New Zealanders at 3%, Chinese at 2%, and people from the Netherlands at just 1%.
It is readily apparent that Chinese live predominantly in the cities up to 99%, whereas only 1% live in the countryside. The other vast majority of city dwellers is New Zealanders and British, which display nearly identical proportions around 90%. In terms of living areas, Australians are few likely to live outside the cities, nearly 20%, while the rest still live in urban environments. Similarly, 83% of the Dutch live in cities and 17% in the countryside.
The table and pie chart give information about the population in Australia according - mẫu 9
The pie chart illustrates the proportion of people of different nationalities in Australia while the table shows their whereabouts.
Overall, the majority of the population has Australian nationality. It is also apparent that people mostly reside in urban areas.
According to the pie chart, a hefty 73% of people living in Australia are Australians. This is followed by the figure for those who hold other nationalities (14%), which is twice as much as that for people of British origin (7%). The remaining groups only account for a minority of the population, with New Zealanders comprising 3%, the Chinese occupying 2% and the Dutch making up 1%.
Regarding the table, it is evident that an overwhelming proportion of residents in Australia are city dwellers regardless of their nationality. Almost all Chinese people, New Zealanders and British people live in cities, at 99%, 90% and 89%, respectively. Likewise, the figures for people of Australian and Dutch descent also show a preference for urban areas, with a ratio of around 8 urbanites to 2 country dwellers.
The table and pie chart give information about the population in Australia according - mẫu 10
Given is the table illustrating how many people residing in Australia based on different nationalities, and the pie chartdelinates the demograph in this country in rural and urban areas.
Overall, the percentage of Australians who dwell in this country dominates the pie chart. By contrast, when it comes to thetable, city dwellers accounts for a vast majority of australia’s population.
According to the pie chart, the proportion of Australiansstand at the top position, at 73%, followed by that of the Britishwith 7%. Simultaneously, the next position belongs to the figure for New zealanders, at 3%. At the same time, around 2%was recorded for the figure of Chinese and Dutch, compared to 14% that of other nationalities.
As seen from the table, regarding the cosmopolitan area, the share of Chinese people ranks first at 99%, which wasapproximately 9% higher than that of NewZealander and British. In the meantime, a mere 82% of Dutch and Australianschoose to live in this area. In terms of the countryside, while the proportion of Australian residents is highest, at 20%, the figures for British, NewZealander and Dutch were comparable, at around 15%. However, Chinese people only have 1% oits population living there, which also occupies the lowest share in the table.
The table and pie chart give information about the population in Australia according - mẫu 11
The provided pie chart illustrates the percentage of people from various nationalities residing in Australia, while the table presents demographic data categorized by urban and rural areas. At first glance at the pie chart, it is evident that the majority of Australians identify their ancestry as Australian. Moreover, a notable observation is that the majority of Australians, regardless of their ethnic background, live in urban areas.
According to the pie chart, individuals of Australian descent constitute nearly three-quarters of the total population. This is followed by individuals from the UK (7%) and New Zealand (3%). Conversely, people of Chinese and Dutch descent account for a marginal 1-2%.
According to the table, approximately 80% of Australians and New Zealanders reside in urban areas, whereas only about 20% live in rural regions. A similar trend is observed among Chinese and New Zealand residents, where the urban population ranges from 90% to 99%.
The table and pie chart give information about the population in Australia according - mẫu 12
The pie chart illustrates the percentage of individuals from various nationalities residing in Australia, while the table presents demographic data categorized into urban and rural areas.
In summary, the pie chart suggests that the majority of Australians claim ancestry of Australian origin. The table also indicates that a significant proportion of Australians, irrespective of ethnicity, reside in urban areas.
According to the pie chart, ethnicity constitutes almost three-quarters of the total Australian population. This is followed by percentages for individuals from the United Kingdom (7%) and New Zealand (3%). Conversely, people of Chinese and Dutch descent account for a negligible 1-2% of the population.
Analyzing the table, approximately 80% of Australians and New Zealanders live in urban areas, with only around 20% residing in rural regions. A similar trend is observed for individuals from China and New Zealand, where the urban population ranges from 90% to 99%.
Xem thêm các bài luận Tiếng Anh hay khác:

TÀI LIỆU CLC DÀNH CHO GIÁO VIÊN VÀ PHỤ HUYNH LỚP 9
+ Bộ giáo án, bài giảng powerpoint, đề thi file word có đáp án 2025 tại https://tailieugiaovien.com.vn/
+ Hỗ trợ zalo: VietJack Official
+ Tổng đài hỗ trợ đăng ký : 084 283 45 85
Đã có app VietJack trên điện thoại, giải bài tập SGK, SBT Soạn văn, Văn mẫu, Thi online, Bài giảng....miễn phí. Tải ngay ứng dụng trên Android và iOS.


Nếu thấy hay, hãy động viên và chia sẻ nhé! Các bình luận không phù hợp với nội quy bình luận trang web sẽ bị cấm bình luận vĩnh viễn.
- Đề thi lớp 1 (các môn học)
- Đề thi lớp 2 (các môn học)
- Đề thi lớp 3 (các môn học)
- Đề thi lớp 4 (các môn học)
- Đề thi lớp 5 (các môn học)
- Đề thi lớp 6 (các môn học)
- Đề thi lớp 7 (các môn học)
- Đề thi lớp 8 (các môn học)
- Đề thi lớp 9 (các môn học)
- Đề thi lớp 10 (các môn học)
- Đề thi lớp 11 (các môn học)
- Đề thi lớp 12 (các môn học)
- Giáo án lớp 1 (các môn học)
- Giáo án lớp 2 (các môn học)
- Giáo án lớp 3 (các môn học)
- Giáo án lớp 4 (các môn học)
- Giáo án lớp 5 (các môn học)
- Giáo án lớp 6 (các môn học)
- Giáo án lớp 7 (các môn học)
- Giáo án lớp 8 (các môn học)
- Giáo án lớp 9 (các môn học)
- Giáo án lớp 10 (các môn học)
- Giáo án lớp 11 (các môn học)
- Giáo án lớp 12 (các môn học)


 Giải bài tập SGK & SBT
 Tài liệu giáo viên
 Sách
Sách
 Khóa học
 Thi online
 Hỏi đáp