
5+ Write a report about the information in the bar chart. Summarize the information by selecting
Write a report about the information in the bar chart. Summarize the information by selecting and reporting the main features, and make comparisons where relevant. Write 180-200 words hay nhất giúp bạn có thêm tài liệu tham khảo để viết bài luận bằng Tiếng Anh hay hơn.
- Write a report about the information in the bar chart. Summarize the information by selecting (mẫu 1)
- Write a report about the information in the bar chart. Summarize the information by selecting (mẫu 2)
- Write a report about the information in the bar chart. Summarize the information by selecting (mẫu 3)
5+ Write a report about the information in the bar chart. Summarize the information by selecting
Đề bài: Write a report about the information in the bar chart. Summarize the information by selecting and reporting the main features, and make comparisons where relevant. Write 180-200 words
Write a report about the information in the bar chart. Summarize the information by selecting - mẫu 1
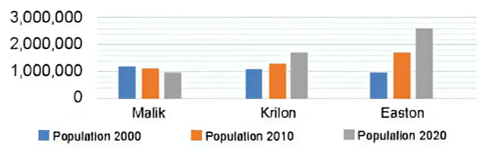
The bar chart illustrates the population growth in three cities - Malik, Krilon, and Easton - over the years 2000, 2010, and 2020.
In 2000, Malik and Krilon had similar populations, both around 1.2 million. However, by 2010, Malik's population remained relatively stable, while Krilon's population saw a slight increase to just over 1.5 million. In 2020, Malik experienced a modest increase to about 1.6 million, while Krilon's population grew more significantly, reaching approximately 2 million.
Easton, on the other hand, showed substantial population growth over the two decades. In 2000, Easton's population was about 1 million, lower than both Malik and Krilon. By 2010, Easton's population had increased dramatically to around 1.8 million, surpassing both Malik and Krilon. This trend continued, and by 2020, Easton's population had surged to nearly 3 million, making it the most populous city among the three.
In summary, Malik experienced minimal population growth over the 20-year period, while Krilon saw a steady increase. Easton, however, showed the most significant growth, with its population nearly tripling from 2000 to 2020. This suggests that Easton has been a major center of population growth compared to the more moderate increases in Malik and Krilon.
Write a report about the information in the bar chart. Summarize the information by selecting - mẫu 2
The bar chart compares the population changes in the cities of Malik, Krilon, and Easton over the years 2000, 2010, and 2020.
In 2000, Malik and Krilon had similar populations, both around 1.5 million, while Easton had the smallest population at approximately 1 million. By 2010, Malik’s population remained almost unchanged at 1.5 million, whereas Krilon saw a slight increase to just over 1.5 million. Easton, however, experienced significant growth, with its population rising to about 1.8 million, surpassing both Malik and Krilon.
The trend continued over the next decade. By 2020, Malik’s population grew modestly to around 1.6 million. Krilon’s population increased more significantly to approximately 2 million. Easton, on the other hand, witnessed dramatic growth, with its population almost tripling from its 2000 figure, reaching nearly 3 million by 2020. This made Easton the most populous city among the three.
In summary, Malik showed the least population growth over the 20-year period, maintaining a relatively stable population. Krilon experienced steady growth, overtaking Malik by 2020. Easton displayed the most remarkable increase, with its population soaring to almost three times its initial size, highlighting Easton as a major hub of population growth compared to the more moderate increases in Malik and Krilon.
Write a report about the information in the bar chart. Summarize the information by selecting - mẫu 3
The bar chart highlights notable population changes in the cities of Malik, Krilon, and Easton from 2000 to 2020.
In 2000, Malik and Krilon had similar populations, around 1.5 million each, while Easton was the smallest with about 1 million residents. By 2010, Malik’s population remained steady at approximately 1.5 million, whereas Krilon experienced a modest increase to just over 1.5 million. In contrast, Easton saw significant growth, with its population rising to about 1.8 million, surpassing both Malik and Krilon.
By 2020, Malik's population had only grown slightly to about 1.6 million, indicating minimal change over the 20 years. Krilon’s population increased more substantially to around 2 million, showing a steady growth trend. Easton exhibited the most dramatic change, with its population nearly tripling from its 2000 figure to reach almost 3 million by 2020.
In summary, Easton demonstrated the most significant population growth, far outpacing Malik and Krilon. While Malik saw minimal changes, Krilon experienced steady growth. Easton’s rapid expansion highlights it as a major center of population growth over the two decades.
Xem thêm các bài luận Tiếng Anh hay khác:

TÀI LIỆU CLC DÀNH CHO GIÁO VIÊN VÀ PHỤ HUYNH LỚP 9
+ Bộ giáo án, bài giảng powerpoint, đề thi file word có đáp án 2025 tại https://tailieugiaovien.com.vn/
+ Hỗ trợ zalo: VietJack Official
+ Tổng đài hỗ trợ đăng ký : 084 283 45 85
Đã có app VietJack trên điện thoại, giải bài tập SGK, SBT Soạn văn, Văn mẫu, Thi online, Bài giảng....miễn phí. Tải ngay ứng dụng trên Android và iOS.


Nếu thấy hay, hãy động viên và chia sẻ nhé! Các bình luận không phù hợp với nội quy bình luận trang web sẽ bị cấm bình luận vĩnh viễn.
- Đề thi lớp 1 (các môn học)
- Đề thi lớp 2 (các môn học)
- Đề thi lớp 3 (các môn học)
- Đề thi lớp 4 (các môn học)
- Đề thi lớp 5 (các môn học)
- Đề thi lớp 6 (các môn học)
- Đề thi lớp 7 (các môn học)
- Đề thi lớp 8 (các môn học)
- Đề thi lớp 9 (các môn học)
- Đề thi lớp 10 (các môn học)
- Đề thi lớp 11 (các môn học)
- Đề thi lớp 12 (các môn học)
- Giáo án lớp 1 (các môn học)
- Giáo án lớp 2 (các môn học)
- Giáo án lớp 3 (các môn học)
- Giáo án lớp 4 (các môn học)
- Giáo án lớp 5 (các môn học)
- Giáo án lớp 6 (các môn học)
- Giáo án lớp 7 (các môn học)
- Giáo án lớp 8 (các môn học)
- Giáo án lớp 9 (các môn học)
- Giáo án lớp 10 (các môn học)
- Giáo án lớp 11 (các môn học)
- Giáo án lớp 12 (các môn học)


 Giải bài tập SGK & SBT
 Tài liệu giáo viên
 Sách
Sách
 Khóa học
 Thi online
 Hỏi đáp