
5+ The chart below gives information about car ownership in the UK from 1975 to 2005
The chart below gives information about car ownership in the UK from 1975 to 2005. Summarise the information by selecting and reporting the main features, and make comparisons where relevant. Write at least 150 words hay nhất giúp bạn có thêm tài liệu tham khảo để viết bài luận bằng Tiếng Anh hay hơn.
- The chart below gives information about car ownership in the UK from 1975 to 2005 (mẫu 1)
- The chart below gives information about car ownership in the UK from 1975 to 2005 (mẫu 2)
- The chart below gives information about car ownership in the UK from 1975 to 2005 (mẫu 3)
- The chart below gives information about car ownership in the UK from 1975 to 2005 (mẫu 4)
- The chart below gives information about car ownership in the UK from 1975 to 2005 (mẫu 5)
- The chart below gives information about car ownership in the UK from 1975 to 2005 (mẫu 6)
- The chart below gives information about car ownership in the UK from 1975 to 2005 (mẫu 7)
- The chart below gives information about car ownership in the UK from 1975 to 2005 (mẫu 8)
5+ The chart below gives information about car ownership in the UK from 1975 to 2005
Đề bài: The chart below gives information about car ownership in the UK from 1975 to 2005. Summarise the information by selecting and reporting the main features, and make comparisons where relevant. Write at least 150 words
The chart below gives information about car ownership in the UK from 1975 to 2005 - mẫu 1
The provided line graph illustrates the changes in number of cars British people owned from 1995 to 2005.
It is noticeable that more people owned cars over the period shown. Additionally, the figure for people with 1 car was consistently highest while the opposite was true for people with 3 cars.
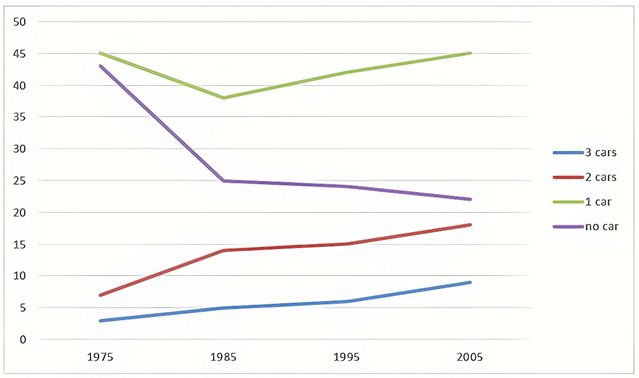
In 1975, 45% of people in the UK owned a single car while the percentage of those with no car was 2% lower, at 43%. Over the following decade, these figures both decreased, with one-car ownership down to 38% and no-car ownership to 25%. While the proportion for British people owning 1 car steadily increased and reached its exact number in 1975 at 45%, the figure for people with no car gradually went down to only 22%.
The percentage of people with 2 and 3 cars experienced a similar pattern over the given period. The figure for people owning 2 cars stood at 7% in 1975, which was 4% higher compared to that for people owning 3 cars. They both increased steadily and reached their highs of 18% (people with 2 cars) and 4% (people with 3 cars).
The chart below gives information about car ownership in the UK from 1975 to 2005 - mẫu 2
The line graph delineates car ownership trends among UK residents, detailing the percentages of households with no cars up to those owning three cars, over three decades starting from 1975.
Overall, there was a significant rise in car ownership during this period, with the number of households owning one car consistently higher than other categories, while the opposite was true for those owning three cars.
In 1975, 45% of households owned a single car, slightly surpassing 43% of households without any car. Over the next decade, both categories experienced a decrease, with single-car ownership falling to approximately 38% and no-car ownership sharply dropping to one quarter. However, from 1985 onwards, the figures for the former recovered and returned to the initial 1975 level of 45%, while those for the latter continued their decline, reaching roughly 22% by 2005.
The most substantial growth was observed in households owning two cars, which increased steadily from about 7% in 1975 to around 18% in 2005. The proportion of households with three cars also increased, although it remained the smallest group. This category grew from a nearly negligible percentage in 1975 to approximately 7% in 2005.
The chart below gives information about car ownership in the UK from 1975 to 2005 - mẫu 3
The line graph shows how car ownership in the UK changed between 1975 and 2005.
Overall, the proportion of people who owned two or three cars rose while the figure for those who owned no car declined. Additionally, having one car was the most common situation during the period shown.
In 1975, nearly half of the UK population had one car while people with no car took up a smaller percentage, at roughly 43%. These figures both declined over the following ten years, to around 37% for people who have one car and 25% for those with no car. The percentage of those who owned 2 or 3 cars was approximately 7% and 3% respectively in 1975, and both experienced increases over the next 10 years to around 13% and 5% respectively.
Over the next 20 years, the percentage of those with one car gradually rose back up to 45% whereas the percentage of those with no car continued to decline to about 22%.
On the other hand, the proportion of people having 2 or 3 cars continued to rise over the following 20 years to 19% and 9% respectively.
The chart below gives information about car ownership in the UK from 1975 to 2005 - mẫu 4
The line graph illustrates the percentage of car ownership in the UK over a 30-year period, from 1975 to 2005. The data is divided into four categories: people owning 1 car, 2 cars, 3 cars, and no car.
Overall, there was a clear increase in the number of people owning one or three cars, while those without a car or with two cars experienced a decline over the period.
In 1975, the majority of UK citizens owned either one or two cars, with 43% of the population having 1 car and approximately 38% owning 2 cars. Over the next three decades, the figure for 1-car households rose steadily, peaking at about 47% in 2005. Conversely, the percentage of those with two cars fell significantly to around 27% in the same year.
Meanwhile, the proportion of people with no car or three cars started at a lower base. In 1975, roughly 8% of households had no car, and around 4% owned 3 cars. Over the years, the share of non-car owners steadily decreased to about 5%, whereas the percentage of those owning 3 cars saw a moderate rise to 12% by 2005.
The chart below gives information about car ownership in the UK from 1975 to 2005 - mẫu 5
The chart below gives information about car ownership in the UK from 1975 to 2005.
Overall, the trend indicates a shift towards increased car ownership over the 30-year period, with a notable rise in the number of individuals owning at least one car.
In 1975, 45% of individuals in the UK possessed a single car, slightly surpassing the percentage of those with no car, which stood at 43%. In the subsequent decade, both percentages declined, with single-car ownership decreasing to 38% and no-car ownership to 25%. While the percentage of individuals owning one car steadily rose to match its initial 1975 number of 45%, the figure for individuals with no car gradually decreased to 22%.
The proportions of individuals owning two and three cars exhibited a similar trend during the period provided. In 1975, 7% of individuals possessed two cars, which was 4% higher than those owning three cars. Both categories increased steadily, reaching their peaks at 18% (individuals with two cars) and 4% (individuals with three cars).
The chart below gives information about car ownership in the UK from 1975 to 2005 - mẫu 6
The line graph details the changes in car ownership in the UK between 1975 and 2005.
Looking at the graph from an overall perspective, it can be seen that most UK residents had only one car. Also, more and more people possessed 2 or 3 cars over the surveyed period, which resulted in a corresponding drop in the figure for people who owned no car.
In 1975, 43% of the UK population had no car at all, approximately close to that of one-car owner at 45%. These figures far exceeded those of two-car and three car owners with 7% and 3% respectively. 10 years later, both percentages of one-car owners and people who had no car saw a precipitous decline of 7% and a dramatic 18% in turn. From this point, the former started to recover back to 45% in 2005, whilst the latter continued to drop slightly and reach a low of 22% at the end of the period. Both figures for owners of two cars and three cars enjoyed steady growth, amounting to 18% and 9% in 2005.
The chart below gives information about car ownership in the UK from 1975 to 2005 - mẫu 7
The line graph illustrates changes in car ownership in the UK over a 30-year period from 1975 to 2005. The graph indicates a significant shift towards increased car ownership in UK households, with a particular rise in those owning two or more vehicles.
Initially, the most common category in 1975 was households with one car, accounting for approximately 43% of the total. This figure, however, experienced a gradual decline over the 30 years, finishing at just under 40% in 2005. In contrast, the proportion of two-car households saw a steady increase from around 25% to surpass the 35% mark by the end of the period, indicating a significant shift in car ownership patterns.
The percentage of households without a car is not provided, yet there is a notable change in the trends of three and four-car households. In 1975, these were the least common, with three-car households making up around 7% and four-car households negligible at 2%. Over time, both categories saw a marked increase, with the percentage of three-car households rising to approximately 17%, while that of four-car households climbed to about 5% in 2005.
This trend suggests a clear move towards higher car ownership in the UK, with a particularly sharp rise in households owning two or more cars. By 2005, the number of households with two cars was nearly equal to those with one car, a considerable change from the situation in 1975.
The chart below gives information about car ownership in the UK from 1975 to 2005 - mẫu 8
The line graph depicts the evolution of automobile ownership in the UK between 1975 and 2005.
Overall, the percentage of individuals who own two or three automobiles increased, while the percentage of persons who do not own a car decreased.
In 1975, fewer than 5% of households had two automobiles. It grew by around 5% after ten years. From 1995 to 2005, the percentage of households driving their own automobile increased gradually, from roughly 6% to 10%. This was the equivalent of three new automobile owners. Between 1975 and 2005, the numbers increased by around 8% to 14%, 15%, and nearly 20%.
About 45 percent of the population did not own an automobile. However, in 1985 this proportion dropped substantially, from around 24%. In 2005, 45 percent of automobile owners had only one vehicle.
Xem thêm các bài luận Tiếng Anh hay khác:

TÀI LIỆU CLC DÀNH CHO GIÁO VIÊN VÀ PHỤ HUYNH LỚP 9
+ Bộ giáo án, bài giảng powerpoint, đề thi file word có đáp án 2025 tại https://tailieugiaovien.com.vn/
+ Hỗ trợ zalo: VietJack Official
+ Tổng đài hỗ trợ đăng ký : 084 283 45 85
Đã có app VietJack trên điện thoại, giải bài tập SGK, SBT Soạn văn, Văn mẫu, Thi online, Bài giảng....miễn phí. Tải ngay ứng dụng trên Android và iOS.


Nếu thấy hay, hãy động viên và chia sẻ nhé! Các bình luận không phù hợp với nội quy bình luận trang web sẽ bị cấm bình luận vĩnh viễn.
- Đề thi lớp 1 (các môn học)
- Đề thi lớp 2 (các môn học)
- Đề thi lớp 3 (các môn học)
- Đề thi lớp 4 (các môn học)
- Đề thi lớp 5 (các môn học)
- Đề thi lớp 6 (các môn học)
- Đề thi lớp 7 (các môn học)
- Đề thi lớp 8 (các môn học)
- Đề thi lớp 9 (các môn học)
- Đề thi lớp 10 (các môn học)
- Đề thi lớp 11 (các môn học)
- Đề thi lớp 12 (các môn học)
- Giáo án lớp 1 (các môn học)
- Giáo án lớp 2 (các môn học)
- Giáo án lớp 3 (các môn học)
- Giáo án lớp 4 (các môn học)
- Giáo án lớp 5 (các môn học)
- Giáo án lớp 6 (các môn học)
- Giáo án lớp 7 (các môn học)
- Giáo án lớp 8 (các môn học)
- Giáo án lớp 9 (các môn học)
- Giáo án lớp 10 (các môn học)
- Giáo án lớp 11 (các môn học)
- Giáo án lớp 12 (các môn học)


 Giải bài tập SGK & SBT
 Tài liệu giáo viên
 Sách
Sách
 Khóa học
 Thi online
 Hỏi đáp