
5+ The chart below shows the percentage of a drug company’s total sales, by region
The chart below shows the percentage of a drug company’s total sales, by region, from 2002 to 2006. Summarise the information by selecting and reporting the main features, and make comparisons where relevant. Write at least 150 words hay nhất giúp bạn có thêm tài liệu tham khảo để viết bài luận bằng Tiếng Anh hay hơn.
5+ The chart below shows the percentage of a drug company’s total sales, by region
Đề bài: The chart below shows the percentage of a drug company’s total sales, by region, from 2002 to 2006. Summarise the information by selecting and reporting the main features, and make comparisons where relevant. Write at least 150 words
The chart below shows the percentage of a drug company’s total sales, by region - mẫu 1
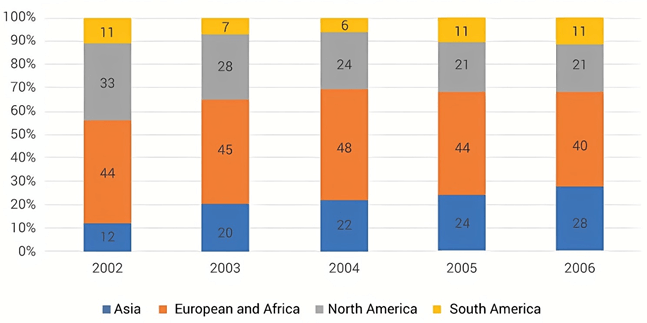
The given bar graph illustrates the share of a drug company’s sales in four regions in five consecutive years starting in 2002. Overall, the figures for Europe and Africa combined and North America decreased, whereas that of Asia increased significantly and South America stayed relatively unchanged despite some fluctuations. Furthermore, the proportion of revenue in Europe and Africa consistently registered the highest statistics throughout the period.
Regarding European and African along with Asian figures, the former started at 44% then grew slightly by 4% to a peak of about a half in 2004 before declining to a low of 40% at the end of the period. By contrast, the statistics in Asia experienced a rapid growth of 16% from a low point of 12% initially to a high of 28% in 2006.
Concerning sales in the two other areas, North America accounted for approximately a third of total sales in 2002 but subsequently plunged to 21% in 2005, and then remained unchanged to end the surveyed period at 2nd place. Conversely, only 11% of aggregate revenue came from South America in 2002, and then this almost halved to a minor 6% in 2004 before recovering to the starting figure in 2006.
The chart below shows the percentage of a drug company’s total sales, by region - mẫu 2
The provided chart depicts the distribution of a pharmaceutical company’s sales across different regions from 2002 to 2006.
Overall, sales proportion in Asia witnessed a consistent upward trend, managing to surpass that of both Europe and America by 2005. The figure for Europe experienced slight fluctuations, while that of America showed a declining trend.
In 2002, America led the sales with 41%, closely followed by Europe at 34% and Asia at 25%. However, by 2003, Asia’s share increased to 30%, narrowing the gap with the figure for both Europe and America at 35%. The following year, Asia’s sales continued to rise, reaching 35%, surpassing that of Europe at 38%, while America’s share decreased to 27%.
By 2005, Asia further strengthened its position with 37% of the company’s total sales, while Europe and America maintained their percentages at 34% and 29%, respectively. Finally, in 2006, Asia emerged as the leading market with 40% of total sales, while Europe and America both experienced declines, with both regions at 30%.
Xem thêm các bài luận Tiếng Anh hay khác:

TÀI LIỆU CLC DÀNH CHO GIÁO VIÊN VÀ PHỤ HUYNH LỚP 9
+ Bộ giáo án, bài giảng powerpoint, đề thi file word có đáp án 2025 tại https://tailieugiaovien.com.vn/
+ Hỗ trợ zalo: VietJack Official
+ Tổng đài hỗ trợ đăng ký : 084 283 45 85
Đã có app VietJack trên điện thoại, giải bài tập SGK, SBT Soạn văn, Văn mẫu, Thi online, Bài giảng....miễn phí. Tải ngay ứng dụng trên Android và iOS.


Nếu thấy hay, hãy động viên và chia sẻ nhé! Các bình luận không phù hợp với nội quy bình luận trang web sẽ bị cấm bình luận vĩnh viễn.
- Đề thi lớp 1 (các môn học)
- Đề thi lớp 2 (các môn học)
- Đề thi lớp 3 (các môn học)
- Đề thi lớp 4 (các môn học)
- Đề thi lớp 5 (các môn học)
- Đề thi lớp 6 (các môn học)
- Đề thi lớp 7 (các môn học)
- Đề thi lớp 8 (các môn học)
- Đề thi lớp 9 (các môn học)
- Đề thi lớp 10 (các môn học)
- Đề thi lớp 11 (các môn học)
- Đề thi lớp 12 (các môn học)
- Giáo án lớp 1 (các môn học)
- Giáo án lớp 2 (các môn học)
- Giáo án lớp 3 (các môn học)
- Giáo án lớp 4 (các môn học)
- Giáo án lớp 5 (các môn học)
- Giáo án lớp 6 (các môn học)
- Giáo án lớp 7 (các môn học)
- Giáo án lớp 8 (các môn học)
- Giáo án lớp 9 (các môn học)
- Giáo án lớp 10 (các môn học)
- Giáo án lớp 11 (các môn học)
- Giáo án lớp 12 (các môn học)


 Giải bài tập SGK & SBT
 Tài liệu giáo viên
 Sách
Sách
 Khóa học
 Thi online
 Hỏi đáp