
5+ The graphs below show the prison population in a European country between 1911 and 2001
The graphs below show the prison population in a European country between 1911 and 2001. Summarise the information by selecting and reporting the main features, and make comparisons where relevant. Write at least 150 words hay nhất giúp bạn có thêm tài liệu tham khảo để viết bài luận bằng Tiếng Anh hay hơn.
5+ The graphs below show the prison population in a European country between 1911 and 2001
Đề bài: The graphs below show the prison population in a European country between 1911 and 2001. Summarise the information by selecting and reporting the main features, and make comparisons where relevant. Write at least 150 words
The graphs below show the prison population in a European country between 1911 and 2001 - mẫu 1
The two line graphs show the male and female population from 1911 to 2001 of a prison in a European country.
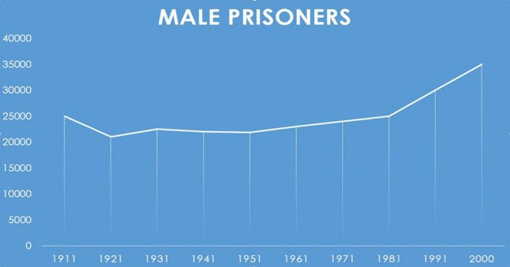
As shown in the first line graph, there were 25,000 male prisoners in 1911. In 1921, the number dropped to approximately 20,000 and leveled out at that point until 1951, after which it rose gradually back to 25,000 after 1981. After that, the number sharply rose before finally peaking at 35,000 in 2001.
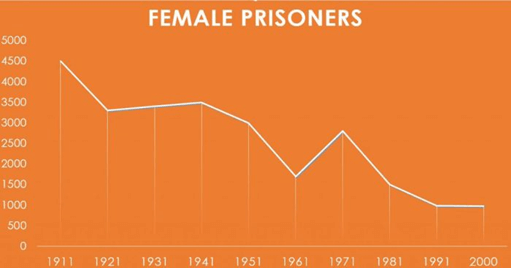
Turning to the second line graph, it is apparent that the population of female prisoners was significantly lower, with highest point of 4500 prisoners at the beginning of the period. The general trend can be described as an erratic downward slope. The number dropped to around 3200 in 1921 and further to just over 1500 in 1961, before rising to a little under 3000 in 1971, and finally declining continuously to the lowest point of less than 1500 prisoners in 2001.
In summary, there are more male prisoners than female prisoners. Moreover, the number of male prisoners increased over the period, whereas that of female prisoners decreased.
The graphs below show the prison population in a European country between 1911 and 2001 - mẫu 2
The provided charts outline the incarceration rates of male and female individuals in a European nation over the span of 90 years, from 1911 to 2001.
Overall, the male prison population showed a consistent increase over the period, in stark contrast to the fluctuating pattern observed in the female prison population. Notably, throughout the entire timeline, the number of male inmates significantly surpassed that of female inmates.
The analysis of the first graph reveals that the count of male prisoners commenced at 25,000 in 1911, which was substantially higher compared to the 4,500 female inmates present during the same year. This number slightly declined to just over 20,000 in 1921 before gradually climbing back to its initial count by 1981. Subsequently, there was a remarkable surge, peaking at nearly 35,000 in the year 2000.
In contrast, the female prison population started at 4,500 in 1911 and witnessed a sharp decrease to around 1,500 in 1961. However, the subsequent decade exhibited a rising trend in the number of female detainees before plummeting to 1,000 in the final years of the timeline.
Xem thêm các bài luận Tiếng Anh hay khác:

TÀI LIỆU CLC DÀNH CHO GIÁO VIÊN VÀ PHỤ HUYNH LỚP 9
+ Bộ giáo án, bài giảng powerpoint, đề thi file word có đáp án 2025 tại https://tailieugiaovien.com.vn/
+ Hỗ trợ zalo: VietJack Official
+ Tổng đài hỗ trợ đăng ký : 084 283 45 85
Đã có app VietJack trên điện thoại, giải bài tập SGK, SBT Soạn văn, Văn mẫu, Thi online, Bài giảng....miễn phí. Tải ngay ứng dụng trên Android và iOS.


Nếu thấy hay, hãy động viên và chia sẻ nhé! Các bình luận không phù hợp với nội quy bình luận trang web sẽ bị cấm bình luận vĩnh viễn.
- Đề thi lớp 1 (các môn học)
- Đề thi lớp 2 (các môn học)
- Đề thi lớp 3 (các môn học)
- Đề thi lớp 4 (các môn học)
- Đề thi lớp 5 (các môn học)
- Đề thi lớp 6 (các môn học)
- Đề thi lớp 7 (các môn học)
- Đề thi lớp 8 (các môn học)
- Đề thi lớp 9 (các môn học)
- Đề thi lớp 10 (các môn học)
- Đề thi lớp 11 (các môn học)
- Đề thi lớp 12 (các môn học)
- Giáo án lớp 1 (các môn học)
- Giáo án lớp 2 (các môn học)
- Giáo án lớp 3 (các môn học)
- Giáo án lớp 4 (các môn học)
- Giáo án lớp 5 (các môn học)
- Giáo án lớp 6 (các môn học)
- Giáo án lớp 7 (các môn học)
- Giáo án lớp 8 (các môn học)
- Giáo án lớp 9 (các môn học)
- Giáo án lớp 10 (các môn học)
- Giáo án lớp 11 (các môn học)
- Giáo án lớp 12 (các môn học)


 Giải bài tập SGK & SBT
 Tài liệu giáo viên
 Sách
Sách
 Khóa học
 Thi online
 Hỏi đáp