
5+ The line graph below illustrates population trends in Vietnam from 1960 to 2020. Write a description of the graph
The line graph below illustrates population trends in Vietnam from 1960 to 2020. Write a description (120-150 words) of the graph. Use the expressions in 1, the model and tips in 2, and the suggestions below to help you hay nhất giúp bạn có thêm tài liệu tham khảo để viết bài luận bằng Tiếng Anh hay hơn.
- The line graph below illustrates population trends in Vietnam from 1960 to 2020 (mẫu 1)
- The line graph below illustrates population trends in Vietnam from 1960 to 2020 (mẫu 2)
- The line graph below illustrates population trends in Vietnam from 1960 to 2020 (mẫu 3)
- The line graph below illustrates population trends in Vietnam from 1960 to 2020 (mẫu 4)
- The line graph below illustrates population trends in Vietnam from 1960 to 2020 (mẫu 5)
5+ The line graph below illustrates population trends in Vietnam from 1960 to 2020. Write a description of the graph
Đề bài: The line graph below illustrates population trends in Vietnam from 1960 to 2020. Write a description (120-150 words) of the graph. Use the expressions in 1, the model and tips in 2, and the suggestions below to help you
The line graph shows population trends in Vietnam from 1960 to 2020. Overall, the urban population ...
In 1960, most Vietnamese people ...
However, from 1960 to 1980, ... From 1990, ...
By contrast, the urban population rose throughout the same period. In 1960, ...
In 1980, ... From 1990, ...
The line graph below illustrates population trends in Vietnam from 1960 to 2020 - mẫu 1
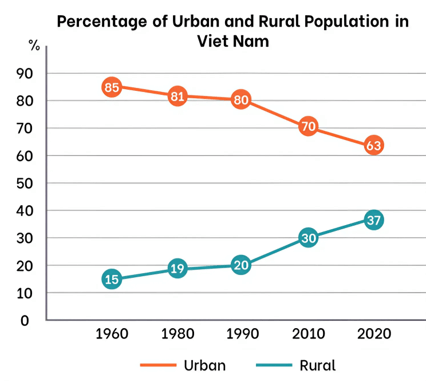
The line graph shows the urban and rural population in Vietnam from 1960 to 2020. Overall, the urban population increased while the rural population decreased.
In 1960, most Vietnamese people lived in rural areas. However, from 1960 to 1980, the percentage of the rural population fell slightly to 81 per cent. Then the figure remained stable for the next ten years. From 1990 to 2000, the proportion of the population living in rural areas continued to decrease gradually. In 2020, the rural population was only 63 per cent of the total population of Vietnam.
By contrast, the urban population rose throughout the same period. In 1960, the percentage of the city population was just around 15 per cent. The figure went up slightly in 1980 and remained stable until 1990 when less than 20 per cent of the population lived in urban areas. Since 1990, the proportion of the urban population has increased gradually and in 2020, it reached 37 per cent of the total population.
The line graph below illustrates population trends in Vietnam from 1960 to 2020 - mẫu 2
The line graph provides information about the proportion of urban and rural population in Vietnam between 1960 and 2020.
Overall, what stands out from the line graph is that the percentage of rural population followed an upward trend, while it was opposite for urban.
To commence with, most Vietnamese people lived in urban areas, accounted for 85%, which was the highest number in the chart in 1960. By contrast, this number decreased slightly by 4% in the next 20 years. Moreover, from 1990 to 2020, the percentage of urban population went down significantly, particularly from 80% to only 63%.
A closer look at the remaining data reveals that the proportion of rural population was approximately 15% throughout the same period, which was the smallest figure in the line graph. However, this number increased moderately to 19% in 1980, rising sharply from 20% to 37%, between 1990 and 2020 respectively.
The line graph below illustrates population trends in Vietnam from 1960 to 2020 - mẫu 3
The line graph shows population trends in Vietnam from 1960 to 2020. Overall, the urban population has decreased significantly, while the rural population has increased over the same period.
In 1960, most Vietnamese people (85%) lived in urban areas, with only 15% residing in rural areas. However, from 1960 to 1980, the urban population slightly decreased to 81%, while the rural population rose to 19%. From 1980 to 1990, the urban population continued to decrease to 80%, and the rural population increased marginally to 20%.
A more pronounced change occurred from 1990 onwards. By 2010, the urban population had dropped to 70%, while the rural population had risen to 30%. This trend continued, and by 2020, the urban population had further decreased to 63%, with the rural population increasing to 37%.
Overall, the data indicates a shift from a predominantly urban population to a more balanced distribution between rural and urban residents in Vietnam over the six-decade period.
The line graph below illustrates population trends in Vietnam from 1960 to 2020 - mẫu 4
The line graph illustrates changes in the urban and rural population percentages in Vietnam from 1960 to 2020. It is notable that while the proportion of rural residents showed a consistent upward trend, the urban population trended downwards.
Initially, the urban population was predominant, peaking at 85% in 1960, the highest point on the graph. However, over the next two decades, this figure decreased slightly by 4%. From 1990 onwards, there was a significant decline in urban population percentage, dropping notably from 80% to 63% by 2020.
Conversely, the rural population started at approximately 15% in 1960, the lowest point shown. This percentage saw a moderate increase to 19% by 1980 and then rose sharply to 37% by 2020.
The line graph below illustrates population trends in Vietnam from 1960 to 2020 - mẫu 5
The line graph shows population trends in Vietnam from 1960 to 2020. Overall, there is a clear shift from a predominantly urban population to a more balanced urban-rural distribution.
In 1960, a vast majority of Vietnamese people (85%) lived in urban areas, with only a small fraction (15%) residing in rural areas. However, from 1960 to 1980, the urban population decreased modestly, falling to 81%, while the rural population grew to 19%.
The trend continued from 1980 to 1990, with the urban population slightly declining to 80% and the rural population rising to 20%. The most significant changes occurred after 1990. By 2010, the urban population had decreased to 70%, and the rural population had increased to 30%.
From 2010 to 2020, the urban population continued to decline, reaching 63%, while the rural population rose to 37%. This indicates a significant migration from urban to rural areas in Vietnam over the past 60 years, leading to a more balanced urban-rural distribution.
Xem thêm các bài luận Tiếng Anh hay khác:

TÀI LIỆU CLC DÀNH CHO GIÁO VIÊN VÀ PHỤ HUYNH LỚP 9
+ Bộ giáo án, bài giảng powerpoint, đề thi file word có đáp án 2025 tại https://tailieugiaovien.com.vn/
+ Hỗ trợ zalo: VietJack Official
+ Tổng đài hỗ trợ đăng ký : 084 283 45 85
Đã có app VietJack trên điện thoại, giải bài tập SGK, SBT Soạn văn, Văn mẫu, Thi online, Bài giảng....miễn phí. Tải ngay ứng dụng trên Android và iOS.


Nếu thấy hay, hãy động viên và chia sẻ nhé! Các bình luận không phù hợp với nội quy bình luận trang web sẽ bị cấm bình luận vĩnh viễn.
- Đề thi lớp 1 (các môn học)
- Đề thi lớp 2 (các môn học)
- Đề thi lớp 3 (các môn học)
- Đề thi lớp 4 (các môn học)
- Đề thi lớp 5 (các môn học)
- Đề thi lớp 6 (các môn học)
- Đề thi lớp 7 (các môn học)
- Đề thi lớp 8 (các môn học)
- Đề thi lớp 9 (các môn học)
- Đề thi lớp 10 (các môn học)
- Đề thi lớp 11 (các môn học)
- Đề thi lớp 12 (các môn học)
- Giáo án lớp 1 (các môn học)
- Giáo án lớp 2 (các môn học)
- Giáo án lớp 3 (các môn học)
- Giáo án lớp 4 (các môn học)
- Giáo án lớp 5 (các môn học)
- Giáo án lớp 6 (các môn học)
- Giáo án lớp 7 (các môn học)
- Giáo án lớp 8 (các môn học)
- Giáo án lớp 9 (các môn học)
- Giáo án lớp 10 (các môn học)
- Giáo án lớp 11 (các môn học)
- Giáo án lớp 12 (các môn học)


 Giải bài tập SGK & SBT
 Tài liệu giáo viên
 Sách
Sách
 Khóa học
 Thi online
 Hỏi đáp