
5+ The graph below shows the three different kinds of emission sources
The graph below shows the three different kinds of emission sources (oil / coal / gas) of greenhouse gas in the UK. Summarise the information by selecting and reporting the main features, and make comparisons where relevant. Write at least 150 words hay nhất giúp bạn có thêm tài liệu tham khảo để viết bài luận bằng Tiếng Anh hay hơn.
5+ The graph below shows the three different kinds of emission sources
Đề bài: The graph below shows the three different kinds of emission sources (oil / coal / gas) of greenhouse gas in the UK. Summarise the information by selecting and reporting the main features, and make comparisons where relevant. Write at least 150 words
The graph below shows the three different kinds of emission sources - mẫu 1
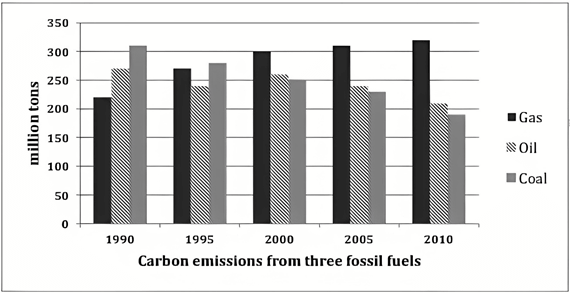
The given column graph depicts the quantities of emissions of greenhouse gases in million tons from three fossil fuels which are gas, oil and coal over a period of two decades. It can be clearly seen that the emissions from gas showed a downward trend, from coal showed an upward trend, whereas the emissions from oil fluctuated over the period.
In 1990, the greenhouse gas emissions from gas stood at 220 million tons. These emissions increased gradually and reached 320 million tons by 2010. The emissions from coal fell markedly from 310 million tons to 190 million tons over the given period of twenty years. The carbon emissions from oil showed fluctuations till 2000 but after that there was a slow decline in carbon emissions till 2010. In 2010 the emissions became 210 million tons from 270 million tons.
Overall, it is interesting to see that from 1990 to 2010, the emissions from gas went from being the least to the most dominant.
The graph below shows the three different kinds of emission sources - mẫu 2
The bar chart illustrates how much carbon emissions were released from gas, oil, and coal in the UK throughout a 20-year period starting from 1990.
Overall, there was an increase in the amount of greenhouse gas emitted from burning gas, while the oil and coal witnessed a downward trend. In addition, at the beginning of the period examined, coal was burned and released the most carbon emissions, but the reverse was true in the final year.
In 1990, the quantity of carbon emissions from coal started at just over 300 million tons, after which it experienced a slight decline to around 270 million tons but still remained the highest position after 5 years. This figure continued to steadily decrease and reached its bottom at just under 200 million tons in 2010. Similarly, the amount of greenhouse gas produced from oil was roughly 265 million tons in the first year, followed by a gradual drop to just under 200 million tons in 2010, despite an insignificant rise in 2000.
By contrast, approximately 220 million tons of carbon emissions were generated by using gas in the UK, with a subsequent dramatic growth to exactly 300 million tons after a decade. In the last 10 years, this figure then kept rising by 10 million tons every five years and peaked at 320 million tons in 2010.
The graph below shows the three different kinds of emission sources - mẫu 3
The given diagram illustrates the three dissimilar types of emissions sources of greenhouse gas in the United Kingdom in the period 20 years from 1990 to 2010, namely oil, coal and gas. It can be clearly seen that the emissions of gas increased over time, while the coal emissions reduced during the period.
In 1990, the carbon emissions from gas stayed at about 220 million tons, and it still went up then reached at 330 million tons in 2000. These emissions increased to 320 million tons in 2010. While that, the emissions released from oil stood at about 270 at the beginning of the period. Then the emissions fell slightly to 240 million tons in 2000, and they continued to decrease to 210 million tons in 2010.
The emissions from coal stood at 310 million tons in 1990. There was a downward trend of the emissions through the remaining years of the periond. The emissions dropped to 270 million tons in the next five years, then fell to 190 million tons at the end of the period.
Xem thêm các bài luận Tiếng Anh hay khác:

TÀI LIỆU CLC DÀNH CHO GIÁO VIÊN VÀ PHỤ HUYNH LỚP 9
+ Bộ giáo án, bài giảng powerpoint, đề thi file word có đáp án 2025 tại https://tailieugiaovien.com.vn/
+ Hỗ trợ zalo: VietJack Official
+ Tổng đài hỗ trợ đăng ký : 084 283 45 85
Đã có app VietJack trên điện thoại, giải bài tập SGK, SBT Soạn văn, Văn mẫu, Thi online, Bài giảng....miễn phí. Tải ngay ứng dụng trên Android và iOS.


Nếu thấy hay, hãy động viên và chia sẻ nhé! Các bình luận không phù hợp với nội quy bình luận trang web sẽ bị cấm bình luận vĩnh viễn.
- Đề thi lớp 1 (các môn học)
- Đề thi lớp 2 (các môn học)
- Đề thi lớp 3 (các môn học)
- Đề thi lớp 4 (các môn học)
- Đề thi lớp 5 (các môn học)
- Đề thi lớp 6 (các môn học)
- Đề thi lớp 7 (các môn học)
- Đề thi lớp 8 (các môn học)
- Đề thi lớp 9 (các môn học)
- Đề thi lớp 10 (các môn học)
- Đề thi lớp 11 (các môn học)
- Đề thi lớp 12 (các môn học)
- Giáo án lớp 1 (các môn học)
- Giáo án lớp 2 (các môn học)
- Giáo án lớp 3 (các môn học)
- Giáo án lớp 4 (các môn học)
- Giáo án lớp 5 (các môn học)
- Giáo án lớp 6 (các môn học)
- Giáo án lớp 7 (các môn học)
- Giáo án lớp 8 (các môn học)
- Giáo án lớp 9 (các môn học)
- Giáo án lớp 10 (các môn học)
- Giáo án lớp 11 (các môn học)
- Giáo án lớp 12 (các môn học)


 Giải bài tập SGK & SBT
 Tài liệu giáo viên
 Sách
Sách
 Khóa học
 Thi online
 Hỏi đáp